

eHoldings Intelligence | TA/Charts | Position Trader//Investor | Bitcoin Monthly Price Action Report | *my tweets are not investment advice.*
Joined September 2011
- Tweets36.4K
- Following878
- Followers2.2K
- Likes102K


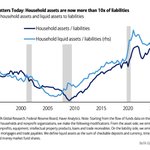


While each participant should proportion according to own goals, needs & tolerance for risk— I believe holding a mix of all three will continue to be best form of savings in forseeable future.

Please find below, The Bitcoin Monthly Price Action Update for September. 🙏
"What I'm currently seeing in Bitcoin's chart is, although daily price action has had a bullish reading over past 2 reports, a fundamental shift on longer time frames still remains indecisive.
As we enter the 4th Q of the year, I suspect this will change & more clarity on Bitcoin's secular trend will emerge."

THE BITCOIN MONTHLY
Price Action Update For Sept./2026
Closing Price- $83,563
S/T Daily Chart-Bullish:
Reading unchanged from August.
Bullish momentum on the daily continued in September, although price action has been consolidating over the past week or so.
Initially, we were expecting resistance at the ~$83K levels— which is marked by the neckline of a potential H&S pattern developing on the weekly & monthly...
although bulls>momentum propelled BTC's price up to~$87,300 in Sept., prior to it now settling closer to weekly resistance at ~$83K levels.
M/T Weekly Chart-Neutral:
Reading unchanged from August.
Sept. weekly price action was positive yet we remain at a neutral reading because of what I believe is still developing.
As indicated on past report, I'd like to see price action clear the 40W EMA via space & time, so not there quite yet.
I'd also like to see what comes of this potential H&S prior to settling on an improved reading.
As you will note, I adjusted the neckline/resistance level with a slight upslope compared to prior month because of daily price action taking BTC to ~$87K levels— pattern is still every much in tact despite.
L/T Monthly Chart-Neutral:
Reading unchanged from August.
Performance for the month was, +6.35%.
Albeit mild, the monthly price action had positive follow through from Aug.'s monthly gain. As indicated, price action is currently consolidating prior to what I believe will only be an interim directional move.
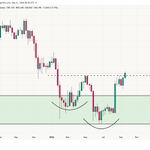
Question that remains is to where? Negate H&S pattern developing because momentum is too strong therefore taking price upwards...
or does a more structured & patient bottom continue to take shape with a retest of ~$65K area?
Time will tell.
Final Note:
In last report I wrote...
Aug.'s price action potentially marked a pivot in bias on the weekly & if successful, will likely change the state of the montly chart also.
It has not as of yet.
What I'm currently seeing in Bitcoin's chart is, although daily price action has had a bullish reading over past 2 reports, a fundamental shift on longer time frames still remains indecisive.
As we enter the 4th Q of the year, I suspect this will change & more clarity on Bitcoin's secular trend will emerge.
My Mode of Action: HOLD (default for core position based on presupposition outlined below).
DCA purchases are in full force as per previous reports & will continue until further notice.
As always, thank you for reading & I remain with friendly greetings. 🙏
S/T = Short Term= <3 months
M/T= Medium Term= 3 months> 1 year
L/T = Long Term= > 1 year
**Mode of Action** is presupposed on the assumption that Bitcoin will appreciate in value over the foreseeable future, thereby having you hold an allocation indefinitely.
There may be rare periods where a sell opinion is advised, although that is not meant to apply to 100%, if any, of your allocation. Position sizing is always according to your own level of risk tolerance & comfort level.
The goal for my reports is to provide a frame of reference as per Bitcoin's current market trend in an effort to maximize positioning thereby improving my average cost basis.
My Bitcoin monthly reports are not to be construed as investment advice; they're for information purposes only.


The U.S. Dollar Index (DXY) first appeared on the charts back in 1973.
Its strongest rally came in 1985, when the greenback rose to ATH's against its basket of peers- a level it has never again approached.
After that peak, the dollar slid more than half its value, bottoming out at ~71 in 2008.
Since then the DXY has been on a steady uptrend, marking the longest upward stretch it’s seen since inception of the index.
Yet, despite the recent rise, the index is still technically in a long‑term downtrend that began after the 1985 high.. each new peak has been lower than the last.
Now the index finds itself at a crossroads.
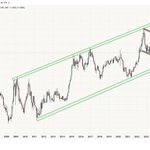
It’s testing the lower boundary of the roughly 15‑year uptrend that has carried it forward, while also coming off its 2022 highs that were just shy of the 2001 peak.
In other words, the DXY could be carving out a new, lower high- perhaps suggesting that the broader secular decline may still be in play....
Or, while the dollar could still be grinding lower, the path of least resistance may actually be found right here, in lower‑range support of its 15‑year up‑channel (see chart below).
That zone could serve as a springboard, allowing the DXY to resume a slow, steady climb back toward its historic ATH?
In my view, I believe the DXY>USD strengthens from here therefore I’m firmly bullish- my position is long on the DXY.

Markets don't need another ETF or passive index strategy... it instead needs the active investing renaissance that is attempting to garner momentum to accelerate.


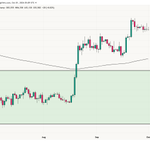
These are the interim key BTC levels I'm currently watching.
We set ATH close on weekly basis via b/o ~2 weeks ago therefore currently retesting that area which is now support.
On daily, the low of Mar.05 of ~$59.3k is of note.
The monthly will also be determined in 12 days, which may indicate a slightly deeper correction.
Thus far, I don't see the price action indicate anything outside of normal corrective move.
Ultimately, we'll see how the weekly finishes up, holding $65.5k levels would be constructive.
Will update accordingly.


THE BITCOIN MONTHLY
Price Action Update For Aug./2026
Closing Price- $78,571
S/T Daily Chart-Bullish:
Reading improved from July.
August's daily price action was strong enough to take the reading from bearish to bullish bias while bypassing a neutral period all together.
On the back of the U.S. Treasury announcing plans to double the size of its long-dated bond buyback operations, BTC bullish momentum returned in Aug.—also completing an H&S bottom we outlined in last report.
I'm expecting some resistance>mild correction at these levels.
M/T Weekly Chart-Neutral:
Reading unchanged from July.
Weekly price action for Aug. was defined by the week of the 17th, evidenced by respective candle on chart below.
A gain of 23% for that week alone & what could very well in hindsight, mark a pivot point in current trend.
The weekly price action is currently challenging the 40W EMA. Albeit slightly broke above this level, I say challenging (hence neutral bias) because I like to see the price action sustain above by some margin & over a period of time given this indicator is dynamic yet with some lag.
Of particular note for the weekly chart is current development as per link below.
xitter.cf/MikeCautillo/status/20…
L/T Monthly Chart-Neutral:
Reading unchanged from July.
Performance for the month was, +25.08%
Last report, I stated...
Albeit stabilized, I wouldn't exactly describe July's montly price action as convincing.
Albeit monthly reading has not confirmed a change in bias as of yet, I'd describe Aug. as convincingly attempting to shift the momentum to the bullish side.
Time will tell if it's effective in doing so for the monthly period.
The same pattern development I outlined in weekly as per link shared above, is also developing on the monthly as outlined on the chart below.
Final Note:
Aug.'s price action potentially marked a pivot in bias on the weekly & if successful, will likely change the state of the montly chart also.
Price action over the last several days is indicating indecision>short term exhaustion in the interim so we'll have to see how things develop in September prior to determining bias.
Irrespective, the current accumulation range is convincinly holding as a bottom thus far therefore has been an effective area to DCA purchases into.
Reiterating a point I've made in the past...
Bottoming price action is often a process & not a timing event. The goal is to consistenlty average in as per well defined & probobalistic ranges.
Bonus perspective below...
xitter.cf/MikeCautillo/status/20…
My Mode of Action: HOLD (default for core position based on presupposition outlined below).
DCA purchases are in full force as per previous reports & will continue until further notice.
As always, thank you for reading & I remain with friendly greetings. 🙏
S/T = Short Term= <3 months
M/T= Medium Term= 3 months> 1 year
L/T = Long Term= > 1 year
**Mode of Action** is presupposed on the assumption that Bitcoin will appreciate in value over the foreseeable future, thereby having you hold an allocation indefinitely.
There may be rare periods where a sell opinion is advised, although that is not meant to apply to 100%, if any, of your allocation. Position sizing is always according to your own level of risk tolerance & comfort level.
The goal for my reports is to provide a frame of reference as per Bitcoin's current market trend in an effort to maximize positioning thereby improving your average cost basis.
My Bitcoin monthly reports are not to be construed as investment advice; they're for information purposes only.


THE BITCOIN MONTHLY
Price Action Update For Sept./2026
Closing Price- $83,563
S/T Daily Chart-Bullish:
Reading unchanged from August.
Bullish momentum on the daily continued in September, although price action has been consolidating over the past week or so.
Initially, we were expecting resistance at the ~$83K levels— which is marked by the neckline of a potential H&S pattern developing on the weekly & monthly...
although bulls>momentum propelled BTC's price up to~$87,300 in Sept., prior to it now settling closer to weekly resistance at ~$83K levels.
M/T Weekly Chart-Neutral:
Reading unchanged from August.
Sept. weekly price action was positive yet we remain at a neutral reading because of what I believe is still developing.
As indicated on past report, I'd like to see price action clear the 40W EMA via space & time, so not there quite yet.
I'd also like to see what comes of this potential H&S prior to settling on an improved reading.
As you will note, I adjusted the neckline/resistance level with a slight upslope compared to prior month because of daily price action taking BTC to ~$87K levels— pattern is still every much in tact despite.
L/T Monthly Chart-Neutral:
Reading unchanged from August.
Performance for the month was, +6.35%.
Albeit mild, the monthly price action had positive follow through from Aug.'s monthly gain. As indicated, price action is currently consolidating prior to what I believe will only be an interim directional move.
Question that remains is to where? Negate H&S pattern developing because momentum is too strong therefore taking price upwards...
or does a more structured & patient bottom continue to take shape with a retest of ~$65K area?
Time will tell.
Final Note:
In last report I wrote...
Aug.'s price action potentially marked a pivot in bias on the weekly & if successful, will likely change the state of the montly chart also.
It has not as of yet.
What I'm currently seeing in Bitcoin's chart is, although daily price action has had a bullish reading over past 2 reports, a fundamental shift on longer time frames still remains indecisive.
As we enter the 4th Q of the year, I suspect this will change & more clarity on Bitcoin's secular trend will emerge.
My Mode of Action: HOLD (default for core position based on presupposition outlined below).
DCA purchases are in full force as per previous reports & will continue until further notice.
As always, thank you for reading & I remain with friendly greetings. 🙏
S/T = Short Term= <3 months
M/T= Medium Term= 3 months> 1 year
L/T = Long Term= > 1 year
**Mode of Action** is presupposed on the assumption that Bitcoin will appreciate in value over the foreseeable future, thereby having you hold an allocation indefinitely.
There may be rare periods where a sell opinion is advised, although that is not meant to apply to 100%, if any, of your allocation. Position sizing is always according to your own level of risk tolerance & comfort level.
The goal for my reports is to provide a frame of reference as per Bitcoin's current market trend in an effort to maximize positioning thereby improving my average cost basis.
My Bitcoin monthly reports are not to be construed as investment advice; they're for information purposes only.
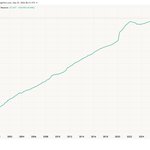
Whether Bitcoin reaches this target isn't as important as the fact that it continues to accrue real value well into the future, consistently outpacing inflation by significant margins.


If I were currently an EM FX holder or manager, I'd consider seeking some refuge, in Bitcoin- in part.

Unbelievable strategy>choke by Elvira on 18th hole.... one of the easiest holes on the course.
Can't believe it.
#DPWorldTour
#Wentworth
#BMWPGAChampionship
Just goes to show the magnitude of green backs>currency printed over the years.
Great for Warren & BRK— he's a legend & learned how to play the game better than anyone else.
Legend.


At the 2:10 mark, Colin Montgomerie says...
And there's an aura about him that I witnessed, that round of golf that I played with him that I hadn't seen before.
I watched Tiger play & win the 2000 Bell Canadian Open on Sunday....where he hit what is arguably his greatest shot of all time— his own words.
This aura Colin describes is exactly how I felt when I first saw him as he approached the green on the first hole.
It was surreal....like he was a super hero. I will never forget it.

“It was like Superman putting on his cape.”
It’s been 25 years since @TigerWoods’ dominant 1997 Masters victory.
A win that has meant so much to so many.
For context, 2000/1 was Tiger's peak as a player— widely considered the greatest individual peak season in golf history.
He secured golf's career grand slam at age of 24, Tiger slam by 25 by winning all 4 majors consequitively although not within same calender year.
He entered 20 tournaments & won 9 of them, with 4 runner-ups. Did not miss a cut & 2000 season still holds the record for the lowest adjusted scoring average in PGA Tour history at 67.79.
No golfer has every played a single season at this level & not sure we'll ever see this type of sheer dominance & execution ever again.

Just an FYI...
some of the largest & most highly ranked airports in the world such as, but not limited to,
Rome's Fiumicino
London's Heathrow
Tokyo's Haneda
are privately operated— often via a hybrid model in concert with government.
Toronto's Pearson which is not, ranks 55th on this list.
worldairportawards.com/world…
