

Ron Milo's lab at the Weizmann Institute of Science
Joined March 2020
- Tweets180
- Following71
- Followers1.4K
- Likes133




1/ Wild mammals now comprise roughly 5% of mammal biomass globally. How did this come to be? In our new study in @NatureComms, we estimate that in 1850, wild mammals comprised ≈50% of mammal biomass globally nature.com/articles/s41467-0…

Reaction is hard: complex multi-step chemistry + discriminating CO₂ from O₂ (Great read: Bathellier et al. 2018, PCE 41:705–716). Rubisco is slow... but doing its best!
4/ Using a simple ML model trained on our data, we inferred rates for all ≈68,000 known rubiscos based on sequences. Predictions suggest the same story: after 3.5 billion years of evolution, nature’s carbon-fixing engine runs at best at ≈30 reactions per second… and that’s it.

3/ The faster rubiscos (15–30 s⁻¹) are found in a few sequence clusters, usually associated with microaerobic environments or CO₂-concentrating mechanisms. Even exploring these groups further, we find a plateau: no faster variants beyond ≈30 s⁻¹. Has evolution hit a ceiling?

2/ We systematically measured rubiscos from the three domains of life, doubling known kinetic diversity. Despite big genetic variation, all stay in a narrow range: most fix CO₂ at <10 s⁻¹, none exceed ≈30 s⁻¹ at 30 °C, far slower than typical metabolic enzymes (≈80 s⁻¹).

1/ How fast can life’s most important enzyme go?
Rubisco catalyzes nearly all carbon fixation on Earth, feeding the biosphere. In our new @PNAS study, we explored ≈500 rubiscos across the tree of life to see if any are actually fast (Spoiler: they aren’t)
pnas.org/doi/10.1073/pnas.25…

5/ Quantifying the biomass movement of all animals and humans reveals the dominant place of humanity on Earth. It is associated with key ecological functions that shape ecosystems and climate, and highlights species whose movement may matter more for conservation.
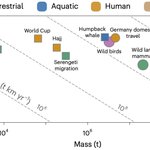
4/ The awe-inspiring African Serengeti migration, with ~1 million wildebeest, zebras & gazelles, barely moves as much biomass as attending the FIFA World Cup or an annual Hajj. But the biggest migration of all? The daily vertical dance of plankton & tiny fish in the ocean.

3/ The ocean still holds the most biomass movement on Earth, but it has been down 60% since 1850, mainly from over-fishing and whaling. Meanwhile, human biomass movement rose by 4000% driven by industrialization and population growth.

2/ Biomass movement = the total mass of animal species × the distance it travels per year.
We used hundreds of studies and datasets to quantify it globally.
On land, birds, mammals & insects move most, but their combined biomass movement is ~40× smaller than that of humans.

1/ Earth is teeming with life on the move, from whales crossing oceans to humans commuting to work. But how does the movement of animals compare to humanity's?
Our new study in @NatureEcoEvo answers just that!
nature.com/articles/s41559-0…

5/ Quantitative estimates such as these establish historical baselines of wild animal populations, so that we can avoid the shifting baseline syndrome - a gradual change in the accepted norms for the condition of the natural environment.
4/ While historical wild mammal biomass estimates have various uncertainties and caveats, they provide a complementary perspective to species extinctions and other metrics in tracking the status of wildlife
3/ Zooming in on marine mammals, their global biomass declined by ≈70% since the 1850s, despite a moderate increase in recent decades. This provides a broader perspective to observed extinctions, with ≈2% of marine mammal species recorded as extinct during the same period

2/ We estimate that wild mammal biomass globally in 1850 was ≈200 Mt, roughly equal to that of humans and their domesticated mammals combined at the time. Since then, human and domesticated mammal biomass has risen to ≈1100 Mt, while wild mammal biomass decreased to ≈60 Mt

6/ Advances in efficiency and low-impact electricity sources could improve the future outlook for vertical farming. Ultimately, we need to carefully consider whether and how best vertical farming contributes to sustainable and secure food production roadmaps
5/ Electricity use alone also leads to substantial greenhouse gas emissions, land use and water consumption. Overall, we find limited environmental benefits afforded by vertical farming with current electricity options

4/ For vertically-farmed vegetable production, electricity is also at least as costly as current production in the field. However, future advances in vertical farming and electricity generation may improve the longer-term economic viability of vertically-farmed vegetables
3/ Using back-of-the-envelope calculations, we find that the electricity cost alone of vertical farming is over one order-of-magnitude (>10x) more expensive than producing current dried staple crops (e.g. wheat and rice)
