

Market Analyst/Trader; Not Financial Advice.
United States, Alabama
Joined September 2019
- Tweets12.3K
- Following952
- Followers12.3K
- Likes17.1K




Pinned Tweet
I'm seriously considering streaming on Twitch at least four days each week and at least one hour each stream. I'm curious how many would consider following me on Twitch streams? Simply reply with a thumbs up or fist pump if interested.
14
31
1,463
ADAUSDC 1-Week Diagonal Ascending Trend Line Chart
Let's see if this Weekly candle can reverse to the upside and CLOSE at the -1.0 White Ascending Trend Line before the next Weekly candle begins.
tradingview.com/x/YMViO9al/


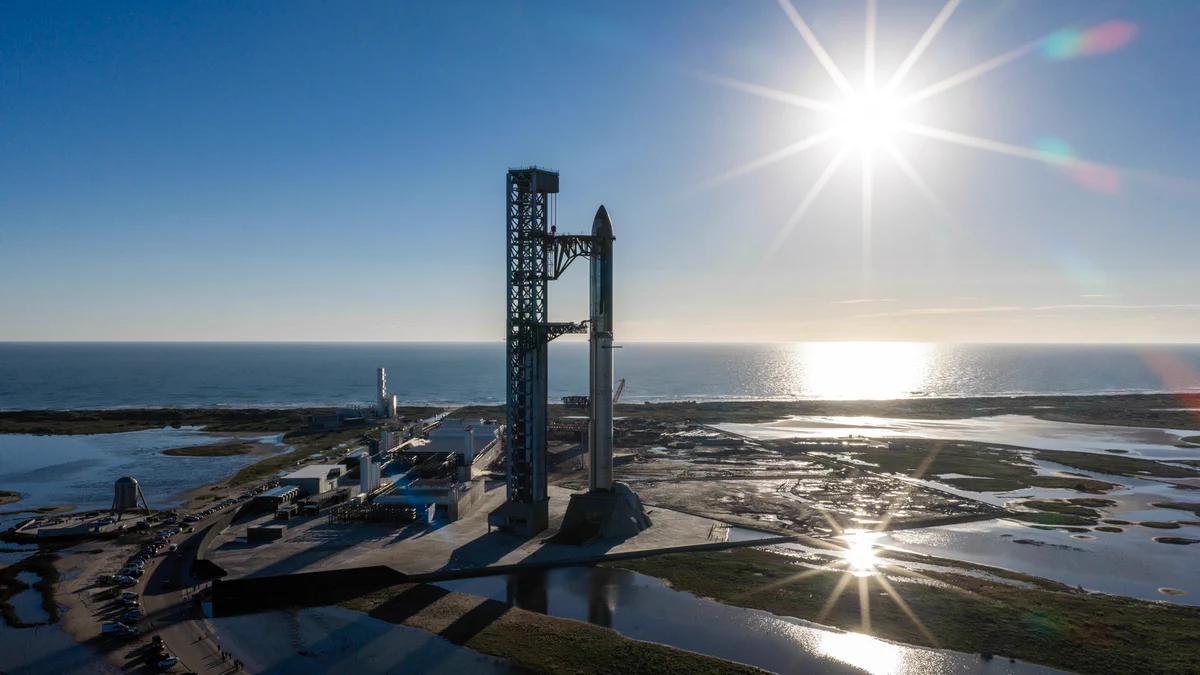
CONGRATS Space X

Good deorbit burn.
Landing burn in 53 minutes. teapawt.org/i/broadcasts/2brajgZlO…
4
754
ADAUSDC 1-Week TF: Still looks like Aqua Lower B-Band at $0.15275 at a minimum. Can go lower...
tradingview.com/x/qTzcfB2t

We have lift off... 6.5 minutes for hopeful version 3 booster catch.
spacex.com/launches/starship…

2
4
659
We could be viewing history today:
spacex.com/launches/starship…
2
645
ADAUSDC 12-hour TF: Red RSI and Blue LSMA have both fallen below Aqua Level 20 in the 12-hour in similar fashion to what we see in the 24-hour TF. Orange Lower B-Band at $0.16070 at this posting.
tradingview.com/x/vZ2R9kkn

10
786
ADAUSDC 24-Hour TF: Red RSI and Blue LSMA have both fallen below Aqua Level 20 increasing odds for price action to fall down with expansion down of B-Bands.
tradingview.com/x/ReuFcWTA

ADAUSDC 1-Week TF: We have relatively high odds of falling down from White Lower B-Band to Aqua Lower B-Band in proximity of $0.15385.
tradingview.com/x/2gdfN0si/

ADAUSDC 6-Day TF: New Red Text Bubble for the 6-Day Time Frame:
tradingview.com/x/ElwZ8he2

7
634
ADAUSDC 5-Day tF: New Red Text Bubble for the 5-Day Time Frame:
tradingview.com/x/EwCDvrbZ

8
600
ADAUSDC 4-Day TF: New Red Text Bubble for the new 4-Day candle:
tradingview.com/x/ZWIhviih

ADAUSDC 3-Day TF: I'm working on a thorough update for Cardano using several time frames. I'll provide a "conclusion" drawn from all time frames when completed. Taking a break to eat something after this post. I'll be back... Here is the 3-Day time frame:
tradingview.com/x/OXDD3rxl

ADAUSDC 2-Day TF: I'm going to post updates on Cardano using several time frames. The 2-Day is the first. I'll provide a "conclusion" after I have posted all time frames I'm going to post. This may take an hour or two. Here's the 2-Day:
tradingview.com/x/K3cLrtuZ

5
568
ADAUSDC 4-Hour TF: New Red Text Bubble written for the 4-hour time frame.
tradingview.com/x/RvTjKaQC/

2
11
837
ADAUSDC Near Term Chart: We get a new 12h, 24h, 2-D and 4-D candle approximately 4-hours from now. I'll provide an update on those four time frames 4 to 8 hours after those new candles begin; giving them time to settle in.
tradingview.com/x/Jktr5h9b

2
16
859
ADAUSDC Ascending Diagonal Support Line Chart: Our -1.0 White Diagonal Trend Line is holding support at present. However, "holding" is "closing" the end of this current 1-Week candle. Just remember "Holding is Closing."
tradingview.com/x/shKAII2M

ADAUSDC 8h: I posted a NEW Red Text Bubble for the 8-hour TF. Looks like potential to go UP FROM White Lower B-Band either the remainder of current 8-hour or the next 8-hour candle.
tradingview.com/x/acDFPALo/

ADAUSDT Weekly Diagonal Support Line Chart: The White - 1.0 Diagonal Support Line continues to hold support at present. I mentioned this previously in the Red Note that price action does NOT have to fall dramatically during a period of downward pressure.
tradingview.com/x/Ht5EQwRj
