




ALT Antibody–antigen test-time scaling on MolBench-AB-26. Mean DockQ is plotted against the number of sampled seeds from 1 to 100 on a logarithmic axis. Blue curves show Mol-1 with 10, 20, and 30 recycling cycles; gray curves show OpenDDE and ESMFold2. Default 20-cycle Mol-1 improves from 0.359 mean DockQ at 1 seed to 0.463 at 100 seeds. For each pair, the highest-confidence candidate is selected from K seeds with 5 samples per seed.

ALT Recycling and sampling efficiency of Mol-1 on MolBench-AB-26. Success means DockQ greater than 0.23, with 5 samples per seed. Three configurations achieve similar success rates: 30 cycles × 5 seeds, 58.64%; 20 cycles × 10 seeds, 58.83%; and 10 cycles × 40 seeds, 58.69%. Their horizontal positions correspond to cycle × seed budgets of 150, 200, and 400. Deeper recycling achieves comparable accuracy with fewer seeds.

ALT Published large-complex predictions in a 5-column, 4-row grid. Each pair of rows compares Anthropic (above) with Mol-1 agent (below) for the same PDB. Top group, Anthropic/Mol-1 TM-scores: 7NAP 0.69/0.985; 9WIE 0.73/0.981; 7VCU 0.54/0.914; 8SU9 0.81/0.895; 7UTD 0.96/0.478. Bottom group: Anthropic reports collapsed structures for all five cases; Mol-1 scores are 1LP3 0.999, 9C3J 0.997, 6HTX 0.995, 9EQW 0.997, 9P4N 0.993. The largest is 9EQW: 60,120 residues, 120 chains. Anthropic used 8 H100/B200 GPUs for the smaller group and 8 B300 GPUs for the larger group; Mol-1 used one H20. Different inference settings; cross-report comparison. Original views are independently scaled. Mol-1 blue is prediction, gray is experiment. Sources: Anthropic report Figures 7-8; Mol-1 report Figure 6.

ALT Two panels show FoldBench-AB success rates and the distribution over all 201,376 five-seed combinations from 32 seeds. Mol-1 scores 75.0%, compared with IsoDDE's plotted 75.6%; Mol-1 with constraints scores 88.3%. In the distribution, 62.22% of combinations reach at least 75% success and 17.85% reach at least 76%.

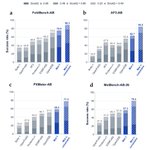
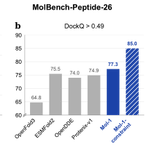
ALT Four antibody-antigen benchmark charts show success rates split by DockQ accuracy level. Adding epitope constraints increases Mol-1 success from 75.0% to 88.3% on FoldBench-AB, 62.7% to 84.2% on AF3-AB, 58.3% to 77.5% on PXMeter-AB and 57.3% to 79.4% on MolBench-AB-26.

ALT Three structural case studies compare Mol-1, sparse epitope guidance and oracle epitope guidance. Sparse three-residue site hypotheses improve DockQ from 0.014 to 0.874 for 7UA2, from 0.011 to 0.739 for 9Z76 and from 0.200 to 0.863 for 9GEI. Predicted structures are overlaid on gray references.