

Wanting to learn, wanting to experience and wanting to have a positive influence. Learning Alteryx and Tableau in DS11 at The Information Lab!
Joined February 2010
- Tweets189
- Following272
- Followers327
- Likes429







A viz I've worked on with my step dad after a dinner conversation.... How many miles are in that steak?!
Looking at how much CO2 1 kg of beef produces in terms of miles driven, absolutely blown away by the numbers.
A change in diet can do a world of good!
public.tableau.com/profile/n…

After discussing trying to eat less meat with my parents and looking at the CO2 data from a previous Makeover Monday the question was asked "How many miles does that mean I can drive?"
So I went into @tableau and did some calculations and couldn't believe the figures....
1
1
I'm running a webinar at 12:30 tomorrow (Weds 16th Dec) on the use of Alteryx to set up weekly paired 'Coffee Chats' for the team to keep up with each other, if you're interested find out more here: meetup.com/Lets-talk-Data/ev…
These chats could help your team get talking!
12
I did a thing; had an idea of something that could be cool, it was kinda cool, made it look mildly cool.
I really like the shape of the developing countries, with the wide bottom, thin top. The shape of some middle eastern countries is scary....
public.tableau.com/profile/n…

Proud to have been coached by @Datajedininja! Freaking amazing, well done Carl!

Pretty big moment for me when I see my @OReillyMedia book for sale on Amazon for the 1st time. Available as an e-book now, print version to come in Sept.
amazon.com/Tableau-Prep-Runn…
Thanks @jonathandrummey @ryanvizzes @JonathanAllenby @kbbolch @danfarmerTIL @barnsleybeast

1
3
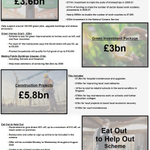
And if anyone is interested in the Summer Statement announced on Wednesday about the UK's financial plan to recover from the pandemic, I created an infographic summarising the contents
public.tableau.com/profile/n…

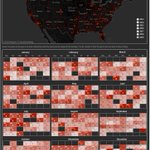
I've been getting interested in the stock market and the finance around them, and the pandemic has been a very interesting time to learn. Something that is particularly interesting me at the moment is what will happen as we come out of the global reaction to Covid-19.
1
1
This morning I put together a simple viz looking at stock market index trackers against unemployment rates, namely the UK and US. The next 6 months will certainly be an interesting time as unemployment rate and economic changes are realised!
public.tableau.com/profile/n…

Do you want to know what Britain's plan for economic recovery is after the hard months since March? 💸
I've created a simple infographic outlining the main points of the Summer Statement released yesterday, find it here: public.tableau.com/profile/n…

1
Seeing the continued systematic racism and violence being shown from the USA's police force is awful, it really seems that a scary amount of the police over there believe themselves above the citizens that they are 'protecting'...
1
6
Not really knowing what I can do to effectively show my concerns for this I've taken inspiration from mappingpoliceviolence.org/ and visualised the deaths caused by police in the U.S.
public.tableau.com/profile/n…

1
5
Found my B2S project from February and remembered that I actually really enjoyed creating it and didn't want it just left on my laptop so published the output to @tableaupublic!
public.tableau.com/profile/n…

1
2
In the midst of a pandemic, it feels almost cruel to be reminded of another silent killer affecting everyone across the globe. But it is an issue that I really care about, so I went back to my shrinking ice caps dashboard to reviz and complete it:
public.tableau.com/profile/n…

1
2
The first attempt was something created when I was starting my @tableau adventure. It wasn't very good (I tried to go too jazzy) and so coming back to it I wanted to focus on simplicity which I generally believe to be what makes the best visualisations.
Has anyone else seen this @tableau Prep error?
I had a flow, which I then added in two aggregations and added those to a previously existing union.

2
I want to give a shout out to this guy, wielding a colander, who is sifting out trash from the canal, putting it in a nearby bin and returning to the sifting. A little bit of this attitude from everyone and we'd be living in a much greater place #EveryoneCanHelp

Playing around with @tableau's 2020.1 beta and thoroughly enjoying watching myself cycle through the city 😆 (it's not Tableau making it judder, that'd be the traffic lights of London)
If you're looking to get started in data then coming along to one of our Meet & Greets could be the first step to doing so. We'll give some demos of Tableau and Alteryx, some time to network with the current Data Schoolers, and pizza!
Check out the link to register
This quoted post is unavailable.
Had the chance to spend an hour or so working on a viz for the Digital Champions challenge at work. I went with my classic, a simple annotated line graph!
Check out the link to see the timeline of Brexit events plotted on the GBP:EUR rate
public.tableau.com/profile/n…

10
If you have a few minutes then please click this link and read, nicely visualised incredibly sad and scary data....


6
After completing my first cycle ride through London, I finally got to join the cool kids and analyse my own @Strava data! Here is the result of yesterday's evening and a few tweaks today, check it out here:
public.tableau.com/profile/n…

Using @alteryx to turn the given 4 fields of data into loads of usable data was really enjoyable and then putting that into @tableau was great fun to have a look at how I had done and to then play around with design 😁 (thanks to @nataliatamiteva for looking over it!)
1
4
Finally got to take my beautiful new bike out on a ride, and do my first proper cycling in about 6 years 😄 thanks @Datajedininja for helping choose such an awesome bike!


2
15
That's week 4 of #preppindata completed! I do like that it is possible to do so many different things all in one tool using @tableau Prep, even if it does make the workflow look much less impressive. The data builder highlighting is a really cool way to get result too

5
Finally gotten around to completing #preppindata week 3, hoping to continue with doing more bits and pieces outside of work as I've not been doing so much recently...

2