

CANSLIM Speculator Founder & Portfolio Manager @ Ninety Plus Capital Winner Jim Roppel Stock Picking Contest Certified Investment Management Analyst (CIMA®) NFA
Houston, TX
Joined February 2021
- Tweets1.1K
- Following52
- Followers737
- Likes6.2K





Continuing with yesterday’s $MU post: if you miss the first breakout, true leaders often give you a second or even a third chance to get in.
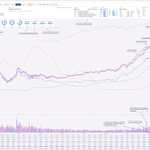
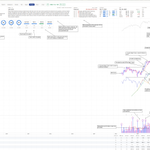
If you missed the September 12, 2025 breakout, MU gave you another shot on December 19. After a 300% prior uptrend, it found support at the 10-week line and broke out of a 5-week stage 2 base on volume 71% above average, rallying 10% on the week to new all-time highs.
The fundamentals had only gotten stronger. MU had a perfect 100 Composite Rating, a perfect 100 Fundamental Rating and a nearly perfect 98 Technical Rating. It ranked as the #2 stock in its sector and #1 in its group, in the best-performing sector and the #24 group. Earnings were up 181% the prior quarter on 45% sales growth, and estimates a year out called for 866% earnings growth, with EPS expected to go from $11.28 to $108.96.
The RS line broke out to a new 52-week high along with price, and TTM earnings and sales estimates were soaring to all-time highs. The market was consolidating at the time, but IBD’s outlook was still bullish, with recommended exposure at 60–80%.
From that breakout, MU rallied 390% to its peak in just 28 weeks.

1
4
888
Yesterday I posted $MU as one of the standout leaders of the last cycle. Here’s another one from further back that follows almost the exact same script: $NVDA in 2017.
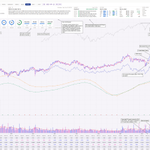
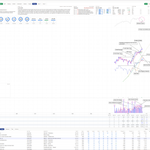
NVDA broke out the same week it reported earnings and launched its new data center GPU. Gaming was still the core business, at about half of revenue and growing nearly 50%. The real story, though, was data center revenue, which grew 186% as Google, Facebook, Amazon and the other cloud giants bought NVDA’s GPUs for deep learning. That same week, Jensen unveiled Volta, its first chip built specifically for training neural networks. The data center story wasn’t new, but it was accelerating fast.
When it broke out, earnings were up 75% on 46% sales growth, after-tax margins were at 20%, and ROE was near 30%. It had a 95 Composite Rating and ranked as the #17 stock in its sector and #7 in its group, and the market was in a confirmed uptrend.
The stock had already run 300% before it ever set up. It then spent 19 weeks building a stage 1 base and broke out with a 23% weekly gain on volume 110% above average. From there it ran another 100% over the next 40 weeks.
Study enough of these and the same pattern keeps showing up. There’s big demand in the prior uptrend, then a long basing period that lasts weeks to months. Then comes an explosive breakout on heavy volume, with the RS line hitting a new 52-week high right along with price. When the fundamentals and the market are lined up behind it, that’s the setup worth looking for.

1
1
287
$HNGE remains one of my only holdings because it has every ingredient we look for as CAN SLIM investors: a perfect 100 Composite, earnings up 42% on 50% sales growth, leadership in both its sector and group, and an RS line that keeps making new highs while the market corrects. Its AI-assisted physical therapy platform is lowering costs for employers and health plans, and with expansion into migraine and GI care, it's one of the clearest leaders in a weak tape. That said, if the market keeps deteriorating it will eventually take the last leaders down with it, so no matter how good a stock looks, you always need a plan to get out.

11
507
There are few better ways to spend your time in a downtrending market than studying the leaders of the prior cycle. One thing I’ve found particularly useful is isolating the buy point and studying the setup into it, because selling takes care of itself when you buy a stock correctly, and I believe CANSLIM practitioners should put most of their focus on proper buy points and managing risk, over complex entry tactics.
$MU was without a doubt one of the all-star leaders of the last cycle. It sat right at the center of the AI high-bandwidth memory bottleneck and had every component we look for as CAN SLIM investors: a 96 Composite Rating, EPS up 757% on 58% sales growth, and estimates calling for TTM earnings to go from $6.44 to $45.12. It also had an 11-week stage 1 cup with handle after a 100% prior uptrend, followed by a breakout to new 52-week highs on rising volume. The RS line broke to a new 52-week high along with the stock, and TTM earnings and sales estimates were both at all-time highs, which is a clue I always look for.
At the time of the buy point, the market was ultra-bullish, with IBD’s recommended exposure at 80–100%, and MU ranked as the #15 stock in its sector and #6 in its group.

Daily portfolio update, which I’m going to try to post every day. Yes, I’m a huge hypocrite after posting about failed breakouts and how rough this tape is for growth stocks, but $HNGE is a half position and keeps showing strength - my risk is at breakeven.

8
370
$ZETA and $FROG are textbook examples of O’Neil’s rule that 3 out of 4 stocks follow the general direction of the market.
Both are fundamentally strong companies that have held up exceptionally well as the market corrected, and outside of healthcare, software is one of the few groups showing real strength on this pullback. Both broke out, yet neither has gotten any real follow-through, which is exactly what you’d expect in this environment because breakouts just don’t work when the market is under pressure.
So you have to ask yourself whether it’s worth trying to thread the needle on the one stock that might work, or whether you’re better off waiting, letting one break out and run without you, and getting some evidence on your side before you put your hard-earned capital at risk.


11
2,192
Going to make a real effort to post on here every day, maybe a few times a day, so here’s a quick intro. I’m Robert Lartigue, a CANSLIM investor trading for about 5 years, mostly focused on the weekly chart as an intermediate-term trend follower, and the 10-week moving average is my line in the sand. I usually run 5 stocks at around 20% each, max long when the market’s good and sitting in cash when it’s not. I’ll be sharing my process, portfolio and whatever’s on my watchlist, and mostly I’m just looking to make friends with other CANSLIM fanatics and talk markets and stocks all day, because honestly there’s nothing I’d rather be doing.
You know the environment is rough when you can only find one stock in the entire market that is working. As hard as it is to sit still, the best traders of all time were patient and could go months without making a trade. Environments like this put that to the test. $HNGE

9
363
Weekly market read, 9/18 close:
Exposure: IBD sits at 60-80%. Feels too high. The tape improved last week, no question, but I want follow-through before I lean in.
Cycle: Week +7 above the 10-week line, but this is not an uptrend. The Nasdaq is treading water and sneaking out narrow up weeks.
Breadth: Accelerating to the downside. Only 38% of S&P 1500 stocks are above their 10-week MA.
New highs vs. lows: Same story. New lows outpaced new highs by 3,049 last week.

Model Book: AppLovin (APP), sell signal February 28, 2025. From the buy point at $46.35 to the sell at $325.74: +603% in 55 weeks.
Two weeks after the $510 peak, APP closed the week down 21.6% on 3.1x average volume, below the 10-week line. All four exit rules on one Friday close. Sell Monday open.
Look at the ratings that weekend. Composite 99, EPS 100, Fundamental 98, RS 90, Money Flow 96, Sector #1 of 11. Every single number was better than at the buy point. The Dec 24 quarter had just printed +253% EPS and +44% sales with 77% gross margin and 55% ROE. Four straight triple-digit quarters. Nothing in the table said sell. It never does. Ratings look their best at the top.
Market gave the same signal. Neutral early in the week, then bearish Thursday and Friday as the Nasdaq broke below its January low. Stock and market on the same Friday close, same as the entry, just in reverse.
The news was two short reports alleging fraud in AXON 2.0, $13.7B in value gone on the week, law firms lining up. Analysts kept their $580 targets and called it a buying opportunity. The rules don't read short reports or price targets.
One more thing on the chart: earlier in the run APP closed below the 10-week line on below-average volume with a 49% closing range. Not a signal. That's the difference between a shakeout and a top.
Gave back about a third of the peak gain. That's what a trailing stop costs, and it's why you keep the rest.

5
350
Model Book: AppLovin (APP), buy point February 9, 2024. From the buy point: +1,001% in 53 weeks.
A 23-week base after a 350% move off the lows. The breakout came the same Friday the S&P 500 closed above 5,000 for the first time. Market had been bearish all week, then the Friday close flipped it to ultra bullish. Stock and market gave the green light on the same day.
The numbers were already there. EPS growth accelerated three straight quarters: +97%, +467%, +400%. Sales went from -11% to +21%. Gross margin 47% to 69%. ROE from negative to +10%. All of it driven by the AXON 2.0 engine that had launched two quarters earlier.
Ratings at the buy point: Composite 90, EPS 98, Sector #1 of 11, Group #9 of 131. RS 72, because the stock was building its base while the market advanced without it.
The news at the time still called it a debated mobile gaming ad company with balance sheet questions. Nobody was calling it an AI winner.
Sell point chart in the next post.

230
Some thoughts on the current market environment.
We're in week six of an uptrend, but it definitely does not feel like one. The market remains trendless and choppy. Only 40% of Nasdaq stocks are above their 50-day moving average. New lows are running ahead of new highs at 2,300+ net and picking up speed. IBD's recommended exposure sits at 40-60%, which feels too high to me. This is an environment where I'd rather be late to the party than the first one through the door.

1
134
Zeta has been on my radar the past few weeks. The chart along with the story is a hard combination to ignore. The company just posted its 20th straight beat-and-raise quarter and is now breaking out of an 80 week stage one base. There's no prior uptrend to lean on which normally makes me hesitate, but it reminds me a lot of the QCOM setup back in the 90s.


1
4
276