

Retired finance professional. I can't see the future and neither can you; anyone who says different has something to sell. NOTHING I SAY IS INVESTMENT ADVICE.
Joined April 2013
- Tweets27.9K
- Following136
- Followers97.8K
- Likes62.1K




Bluekurtic handing out free money as usual.

This is weird. For only the 11th time in $SPY history, a 1% down day was followed by two consecutive days within that day's open to close range.
That's unusually rangebound after a sharp decline. The S&P 500 was positive in 10/10 prior cases in next 2 months with strong gains.

ALT Bluekurtic chart showing a rare S&P 500 pattern in which a decline of over 1% is followed by two consecutive sessions confined within the declining day's open-to-close range. Since 1993, this pattern has occurred only eleven times, including October 20, 2026. In all prior instances, SPY was higher two months later.


This fucking app.
I spend dozens and dozens of hours a week creating red hot, original content for this fucking site. I have a decent following. I follow the rules.
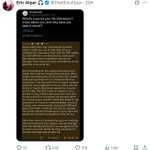
Then this account, with 850k followers, posts this fucking screenshot of a reddit post from SEVEN AND A HALF FUCKING YEARS AGO and it gets 1.7m impressions and 539 reposts.
I thought X was getting rid of this shit with the new program? I thought we no longer had to wade thru a FOR YOU that was, in fact, FOR NOBODY and was just screenshots from other social media platforms from almost a fucking goddamn decade ago.


VIX closed Friday 4.49 pts above its average close the past 50 trading days.
This is the 4th time that's ever happened on a Friday in October when SPX was down at least -1% that day.
And how did SPX do going forward after the other 3 events in history?
Really.
Fucking.
Well.

VIX just spent 50+ days fully under 20 before seeing a mid-day spike at least 3.00+ higher than the highest point of the past 50 days.
Here are these SPX 3-day forward returns after every event like this in the past 20 years
-2.8%
-7.7%
-0.1%
-1.3%
-2.6%
-0.1%
+0.9%
-1.8%
-0.8%

