





ALT Blue background image with white text. Subheader reads "peoplescdc.org" Header reads "FIGHT FACISM" Text reads "At People's CDC, we have watched in dismay as governments and corporations slash funding for programs that keep people housed, fed, and vaccinated; cut programs that track and control the spread of diseases; dismantle life saving research. They claim, 'There's not enough money for that,' yet they find billions for war, policing, and projects that make themselves and their friends richer. "This didn't start with MAGA, btw.) We're taught success comes through individualism. But when we share the same planet, the same air, the same future, we must reject the lie that we success or fail alone. We have to create systems within our communities, while building different forms of governance that prioritize everybody's wellbeing. That means collectively enacting basic public health measures to stop deadly, disabling diseases like COVID-19 and measles: Wear high-quality masks......


ALT Heading: "12 states and territories experiencing high or very high levels." Subheading: "The Weather Report 10/19/26" A COVID wastewater map of the United States based on the CDC’s data. Heading level two text: “COVID wastewater map.” Subheading text: “October 4 - October 10, 2026.” Florida, Mississippi, Oregon, the U.S. Virgin Islands and Washington are experiencing “very high” levels. California, Connecticut, Georgia, Hawaii, Montana, South Carolina and Tennessee are experiencing “high” levels. Alabama, Alaska, Delaware, Idaho, Kentucky, Maryland, Massachusetts, Nevada, New Jersey, North Carolina, South Dakota, Utah, Texas and Rhode Island, are experiencing “moderate” levels. North Dakota, Oklahoma, and Guam have limited or no data. The remainder of the county is experiencing “low” or “very low” levels. Footer: "Source: CDC, Data Updated: 10/15/26, PeoplesCDC.org"

ALT Heading: "The Weather". Along with the “People’s CDC” logo. Body text: "Though CDC and WastewaterSCAN differ on what levels they choose to label as “High” vs “Low,” when referencing the graphs for the past few surges, both data sets tell similar stories. In both CDC and WastewaterSCAN’s data we see surges in late summer of 2025, in the winter holidays between November 2025 and March 2026, as well as a surge right now. WastewaterSCAN data shows the highest peak in national levels for this current surge has already surpassed the high point during the surge associated with the 25’/26’ winter holidays. CDC readings show the highest national point in this current surge as ~73% as high as the highest point from the 25’/26’ winter holidays." Footer: "The Weather Report 10/19/26, peoplescdc.org"

ALT Heading: "Average national COVID wastewater level rises to moderate." Along with the “People’s CDC” logo. A line graph, based on CDC’s data. Heading level two: “COVID Wastewater Trends.” The y-axis is COVID concentration levels, from bottom to top, goes from “very low” to “very high.” The x-axis lists dates, from left to right, going from August 2025 through October 10, 2026. The graph shows 2 previous waves in late summer 2025 and winter 2025-2026. Mid-summer 2026 shows a few months of every region of the US in “very low”, followed by an ongoing and still growing wave that started back around the start of July 2026. Midwest region is still “very low”. The northeast and national average have been fluctuating around the boundary between “low” and “moderate”. The West and South are averaging in the “moderate” now. Footer: "Source: CDC, Data Updated: 10/15/26, peoplescdc.org"

ALT Heading: "All regions assigned the category of high according to Wastewater Scan". Along with the “People’s CDC” logo. Heading level 2: “Wastewater Scan wastewater map.” Graphic depicts a map of the United States separated into four regions: West, Midwest, South, and Northeast. A key in the lower right corner indicates wastewater concentration levels: orange for high, yellow for medium, blue for low, green for not detected, and gray for not calculated. All regions are highlighted orange. There are individual wastewater treatment plants, indicated by dots, scattered across the map. The dots follow the same color key as regions. Most dots across all regions are high or medium, with some low or not calculated. There are no plants reporting “not detected”. Footer: "Source: CDC, Data accessed: 10/16/26, peoplescdc.org"

ALT Heading: "Wastewater Scan data, similar to CDC data shows peaks in late summer 2025, winter holidays 2025-2026, and now." Along with the “People’s CDC” logo. A line graph, WastewaterSCAN Data. Heading level two text: “Wastewater Scan COVID wastewater trends.” Subheading text, “All charts show quantity of nucleic-acids, PMMoV Normalized (x1 million).” The y-axis is COVID concentration levels, from bottom to top, goes from 0 to 1,400. The x-axis lists dates, from left to right, going from October 2024 through October 12, 2026. The national line on the graph peaks in Dec 2024-Jan 2025 (though not mentioned in heading), late summer 2025, Dec 2025-Feb 2026. From February 2026, and onwards the graph slopes down to a very low level until it starts going up in June and July 2026. At the current point in October of 2026, levels are increasing in the south and nationally, and decreasing in the northeast, midwest and west. Footer: "Source: CDC, Data accessed: 10/16/26"

ALT Heading: "How to read wastewater data." Along with the “People’s CDC” logo. Body text: "When reading wastewater data it is important to examine the graphical representation of the data over time rather than reading the subjective/qualitative label of “High, “Low,” etc that is applied by an organization or researcher. It is critical to think of this current surge and its relation to prior events. From our current place in the surge, these levels could still grow. Now is a good time to take additional precautions — such as becoming more rigorous in our masking practice — to prevent the current levels from increasing further. To find the most relevant data to your area and get even more specific than your continental region or state, check out the wastewater station in the city that’s nearest to you." Footer: "The Weather Report 10/19/26, peoplescdc.org"

ALT Heading: "Always check the levels for the wastewater treatment plant nearest to you." Along with the “People’s CDC” logo. A line graph, based on CDC’s data. Heading level two text: “COVID wastewater trends for Warren, Michigan.” The y-axis is SARS-CoV-2 nucleic acid levels in Quantity of nucleic-acids, PMMoV Normalized (x1 million) going from 0 to 4,500. The x-axis lists months, from left to right, going from October 2024 to October 2026. The line graph peaks in December 2025. From February 2026, and onwards, the line graph goes down with occasional increases. In August 2026, levels began increasing again then decreased by early October. In December of 2025 the line graph peaks to its highest point and then gradually decreases from January to April. A much smaller peak arises in August of 2026 which, at the current moment, continues to gently rise and fall. Footer: "Source: CDC, Date accessed: 10/16/26, peoplescdc.org"

ALT Heading: "measles cases rise by 574 in the past two weeks for a total of 4,603 cases this year." Along with the “People’s CDC” logo. A line graph, based on Johns Hopkins University data. Heading level two text: “Cumulative measles cases reported in the United States by year.” The y-axis is documented measles cases from 0 to 4500. The x-axis lists number of weeks into the calendar year from 0 to 52. Multiple lines are shown to indicate measles case counts over time per year from 2018 to 2026. The line for 2019 reaches about 1250 cases. The line for 2025 reaches just under 2500. The line for 2026 passes 4500, with some time left in the year for it to grow even more. The slope of the graph (representing the rate of measles case incidence) where the line currently ends is as steep as it has ever been on the graph. All other years are below 500. Footer: "Source: CDC, Data Updated: 10/16/26, peoplescdc.org"

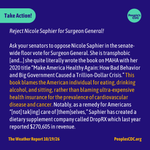
ALT Heading: "Take action!" Along with the “People’s CDC” logo. Body text: "Reject Nicole Saphier for Surgeon General! Ask your senators to oppose Nicole Saphier in the senate-wide floor vote for Surgeon General. She is transphobic [and...] she quite literally wrote the book on MAHA with her 2020 title “Make America Healthy Again: How Bad Behavior and Big Government Caused a Trillion-Dollar Crisis.” This book blames the American individual for eating, drinking alcohol, and sitting, rather than blaming ultra-expensive health insurance for the prevalence of cardiovascular disease and cancer. Notably, as a remedy for Americans “[not] tak[ing] care of [them]selves,” Saphier has created a dietary supplement company called DropRX which last year reported $270,605 in revenue. " Footer: "The Weather Report 10/19/26, peoplescdc.org"

ALT Heading: “Get the WR in Your Inbox”. Along with the “People’s CDC” logo. Body text: "Access hyperlinks and read the full report on our website or subscribe to our Substack to receive the weekly report in your inbox: substack.com/peoplescdc Check out PeoplesCDC.org for more action items, petitions, and toolkits. With love, People’s CDC Weather Report Footer: "The Weather Report 10/19/26, peoplescdc.org"


ALT Heading: "Five states experiencing "high" or "very high" levels." Subheading: "The Weather Report 10/05/26" A COVID wastewater map of the United States based on the CDC’s data. Heading level two text: “COVID Wastewater Map.” Subheading text: “September 20 - September 26, 2026.” The following color codes depict viral activity levels from lowest to highest: “very low” in dark green, “low” in light green, “moderate” in yellow, “high” in pink, and “very high” in red. “Limited/no data” is shown in gray. Texas and Hawaii are experiencing “very high” levels. Washington, Massachusetts, and Connecticut are experiencing “high” levels. Oregon, California, Montana, Mississippi, and Florida are experiencing “moderate” levels. North Dakota, Oklahoma, Guam, and the U.S. Virgin Islands have limited or no data. The remainder of the county is experiencing “low” or “very low” levels. Footer: "Source: CDC, Data Updated: 10/01/26, PeoplesCDC.org"

ALT Heading: "The Weather". Along with the “People’s CDC” logo. Body text: "According to the CDC’s COVID Wastewater Viral Activity map, Hawaii and Texas are experiencing “Very High” levels. Connecticut, Massachusetts, and Washington are experiencing “High " levels. Five states are experiencing “Moderate” levels. Twelve states are experiencing “Low” levels, and 26 states are experiencing “Very Low” levels. Arkansas, Arizona, Mississippi, South Dakota, Maryland, New Hampshire, and Montana are reporting “Limited Coverage*.” Oklahoma, North Dakota, Washington, D.C., Guam, and the US Virgin Islands are reporting “Limited/No Data.”" Footer: "The Weather Report 10/05/26, peoplescdc.org"

ALT Heading: "All regions now “Low” to “Very Low”". Along with the “People’s CDC” logo. A line graph, based on CDC’s data. Heading level one text: “West has fallen to “low,” “All regions now “low” or “very low.” Heading level two text: “COVID Wastewater Trends.” The y-axis is COVID concentration levels, from bottom to top, goes from “very low” to “very high.” The x-axis lists dates, from left to right, going from January 2026 through September 26, 2026. The line graph peaks in January 2026 - February 2026. From February 2026, and onwards, the line graph goes down. On August 1st all levels begin trending up. Currently all regions are “low” or “very low.” Footer: "Source: CDC, Data Updated: 10/01/26, peoplescdc.org"

ALT Heading: "The Weather". Along with the “People’s CDC” logo. Body text: "Regional trend data from the CDC indicate decreases in every region. The South and the West are in the “low” category, and the other regions are in the “very low” category. As a reminder, these categories should not be thought of as corresponding to any person’s risk of catching COVID. Remember other scientists can look at similar data and, using different systems, come to alternate conclusions. At Wastewater SCAN, for example, the team has determined all regions to be in the “high” category." Footer: "The Weather Report 10/05/26, peoplescdc.org"

ALT Heading: "All regions assigned category of “High” according to Wastewater SCAN." Along with the “People’s CDC” logo. Heading level 2 text: “Wastewater SCAN map.” Graphic depicts a map of the United States separated into four regions: West, Midwest, South, and Northeast. A key in the lower right corner indicates wastewater concentration levels: orange for high, yellow for medium, blue for low, green for not detected, and gray for not calculated. All regions are highlighted orange. There are individual wastewater treatment plants, indicated by dots, scattered across the map. The dots follow the same color key as regions. Most dots across all regions are orange or yellow. Footer: "Source: CDC, Date accessed: 10/04/26, peoplescdc.org"

ALT Heading: "Tips for using wastewater data" Along with the “People’s CDC” logo. Body text: "When you’re thinking about wastewater near you, the best thing you can do is find the wastewater station nearest you that reports levels, and look at levels over time. For example, for someone living in St. Clair Shores, MI, putting your zip code into Wastewater SCAN’s dashboard shows that the nearest wastewater treatment plant is in Warren, MI. If we look at the levels over the last year from the Warren plant, we see that they are not nearly as low as they were through most of the spring and summer, but lower than they were last year at this time and not nearly as high as they were last winter. " Footer: "The Weather Report 10/05/26, peoplescdc.org"

ALT Heading: "Current levels are higher than spring/summer 2026 but lower than fall/winter 2025". Along with the “People’s CDC” logo. A line graph, based on CDC’s data. Heading level one text: “Current levels higher than spring/summer 2026 but lower than fall/winter 2025.” Heading level two text: “1-year trend of COVID wastewater levels in Warren, MI.” The y-axis is SARS-CoV-2 nucleic acid levels in Quantity of nucleic-acids, PMMoV Normalized (x1 million) going from 0 to 4,500. The x-axis lists months, from left to right, going from October 2025 to October 2026. The line graph peaks in December 2025. From February 2026, and onwards, the line graph goes down with occasional increases. In August 2026, levels began increasing again then decreased by September. Footer: "Source: CDC, Data Updated: 10/04/26, peoplescdc.org"

ALT Heading: "2026 measles cases surpass 4,000". Along with the “People’s CDC” logo. A line graph, based on Johns Hopkins University data. Heading level two text: “Cumulative measles cases reported in the United States by year.” The y-axis is documented measles cases from 0 to 4000. The x-axis lists number of weeks into the calendar year from 0 to 52. Multiple lines are shown to indicate measles case counts over time per year from 2018 to 2026. The line for 2019 reaches about 1250 cases. The line for 2025 reaches just under 2500. The line for 2026 passes 4000. All other years are below 500. Footer: "Source: CDC, Data Updated: 10/02/26, peoplescdc.org"

ALT Heading: "Take Action!" Along with the “People’s CDC” logo. Body text: "The next time someone brings up the Boston-area lesbian bar, pivot the conversation toward organizing. Ask them if they want to have a few meetings with administrators at the school to talk about improving air quality. See if they want to join a call to speak with your union representatives about pushing for reinstating additional paid sick days for folks with COVID and a testing-based approach to returning to work. And you don’t have to wait for them to bring it up. Coordinate a masked karaoke event for your tenants association. Write to us about what you’re working on, so we can celebrate you in our next “wins” section! " Footer: "The Weather Report 10/05/26, peoplescdc.org"

ALT Heading: “Get the WR in Your Inbox”. Along with the “People’s CDC” logo. Body text: "Access hyperlinks and read the full report on our website or subscribe to our Substack to receive the weekly report in your inbox: substack.com/peoplescdc Check out PeoplesCDC.org for more action items, petitions, and toolkits. With love, People’s CDC Weather Report * Based on a small segment (less than 5%) of the population and may not be representative of the state/territory." Footer: "The Weather Report 00/00/26, peoplescdc.org"


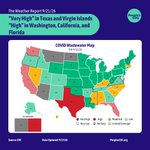
ALT Heading: "“Very High” in Texas and Virgin Islands “High” in Washington, California, and Florida" Subheading: "The Weather Report 9/21/26" A COVID wastewater map of the United States based on the CDC’s data. Heading level two text: “COVID Wastewater Map.” Subheading text: “September 6 - September 12, 2026.” Texas and the Virgin Islands are experiencing “very high” levels. Washington, California, and Florida are experiencing “high” levels. Nevada, Mississippi, Alabama, North Carolina, South Carolina, Kentucky, Massachusetts, and Hawaii are experiencing “moderate” levels. Much of the Midwest and Northeast is experiencing “low” levels. A few states scattered across the country are experiencing “very low” levels. Montana, North Dakota, Arizona, and Guam are gray meaning “limited/no data.” Footer: "Source: CDC, Data Updated: 9/17/26, PeoplesCDC.org"

ALT Heading: "The Weather". Along with the “People’s CDC” logo. Body text: "Texas and the Virgin Islands are experiencing “Very High” levels. Washington, California, and Florida are experiencing “High” Levels. Eight states are experiencing “Moderate” levels. 13 states and Washington DC are experiencing “Low” levels, and 22 states are experiencing “Very Low” levels. Arkansas, Mississippi, New Hampshire, Oklahoma, Oregon, and Virginia are all reporting “Limited Coverage,” meaning that the data is based on less than 5% of the population and may not be accurate for the entire state. Arizona, Guam, North Dakota, and Montana are reporting “Limited/No Data.”" Footer: "The Weather Report 9/21/26, peoplescdc.org"

ALT Heading: "West has fallen to “Low” other regions remain “Low” or “Very Low”". Along with the “People’s CDC” logo. A line graph, based on CDC’s data. Heading level one text: “West has fallen to “low,” “Other regions remain “low” or “very low”” Heading level two text: “COVID Wastewater Trends.” The y-axis is COVID concentration levels, from bottom to top, goes from “very low” to “very high.” The x-axis lists dates, from left to right, going from January 2026 through August 29, 2026. The line graph peaks in January 2026 - February 2026. From February 2026, and onwards, the line graph goes down. On August 1st levels in the South and West begin to trend up again. Currently all regions are “low” or “very low.” Footer: "Source: CDC, Data Updated: 9/17/26, peoplescdc.org"

ALT Heading: "The Weather" Along with the “People’s CDC” logo. Body text: "Regional trend data from the CDC indicate the West has the highest wastewater viral activity but is trending downwards into the “Low” category. The South remains “Low” and is trending downwards. The Northeast and Midwest are both considered “Very Low,” with upward and stable trends, respectively." Footer: "The Weather Report 9/21/26, peoplescdc.org"

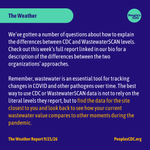
ALT Heading: "The Weather" Along with the “People’s CDC” logo. Body text: "We’ve gotten a number of questions about how to explain the differences between CDC and WastewaterSCAN levels. Check out this week’s full report linked in our bio for a description of the differences between the two organizations’ approaches. Remember, wastewater is an essential tool for tracking changes in COVID and other pathogens over time. The best way to use CDC or WastewaterSCAN data is not to rely on the literal levels they report, but to find the data for the site closest to you and look back to see how your current wastewater value compares to other moments during the pandemic." Footer: "The Weather Report 9/21/26, peoplescdc.org"

ALT Heading: "COVID infections are “Growing” or “Likely Growing” in 27 states ". A map of the United States color-coded in shades of purple, teal and gray displaying the CDC COVID Model: Current Epidemic Growth Status based on emergency department visits as of September 16, 2026, where purple tones indicate “Growing” or “Likely Growing”, teal tones indicate “Declining” or “Likely Declining”, and gray indicates “Not Changing.” States without predictions are represented in white. Most of the northern half of the country is a shade of purple indicating COVID infections are “growing” or “likely growing".” Most of the southern half of the country are shades of green indicating COVID infections are “declining” or “likely declining”. A band of states across the middle of the country are white indicating COVID infections are “not changing. Footer: "Source: CDC, Data Updated: 9/16/26, peoplescdc.org"

ALT Heading: "CDC epidemic trends" Along with the “People’s CDC” logo. Body text: "According to CDC Epidemic Trend data last updated on September 16th, the number of infections is estimated to be “Growing” or “Likely Growing” in 27 states. It is “Declining” or “Likely Declining” in 13 states, and not changing in 10 states. These values are estimations based on a formula rather than measured data. It is estimated from daily incident emergency department visits reported through the National Syndromic Surveillance Program. An Rt < 1 does not mean that transmission is low, just that infections are declining. They could be declining from a high level to another slightly lower high level." Footer: "The Weather Report 9/21/26, peoplescdc.org"

ALT Heading: "9/11 Health Impacts — 25 Years Later" Along with the “People’s CDC” logo. Body text: "On September 8, the Mamdani administration in New York City launched a portal of 170,000 previously classified documents related to the attacks, along with memos revealing the city’s mishandling of the response. New Yorkers were led to believe the air was safe, when it remained laden with pollutants for months. Instead, city officials downplayed concerns for a premature “back to normal” approach to avoid the responsibility of guaranteeing clean air. If you haven’t watched it yet, we recommend checking out Democracy Now’s coverage of the 9/11 response. We recognize in this story the same prioritization of “normal” for the sake of global markets and to the detriment of public health that characterized the COVID response." Footer: "The Weather Report 9/21/26, peoplescdc.org"

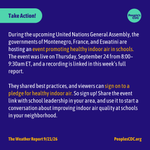
ALT Heading: "Take action!" Along with the “People’s CDC” logo. Body text: "During the upcoming United Nations General Assembly, the governments of Montenegro, France, and Eswatini are hosting an event promoting healthy indoor air in schools. The event was live on Thursday, September 24 from 8:00–9:30am ET, and a recording is linked in this week’s full report. They shared best practices, and viewers can sign on to a pledge for healthy indoor air. So sign up! Share the event link with school leadership in your area, and use it to start a conversation about improving indoor air quality at schools in your neighborhood." Footer: "The Weather Report 9/21/26, peoplescdc.org"

ALT Heading: “Get the WR in Your Inbox”. Along with the “People’s CDC” logo. Body text: "Access hyperlinks and read the full report on our website or subscribe to our Substack to receive the weekly report in your inbox: substack.com/peoplescdc Check out PeoplesCDC.org for more action items, petitions, and toolkits. With love, People’s CDC Weather Report Footer: "The Weather Report 9/21/26, peoplescdc.org"


ALT Heading: ""Very High" levels in Texas, "High" levels in Arizona, Montana, Mississippi, and Hawaii." Subheading: "The Weather Report 9/7/26" A COVID wastewater map of the United States based on the CDC’s data. All of the states that touch the Southern border of the country are experiencing “moderate,” “high,” or “very high” levels except for New Mexico which is “low.” Seven states that touch the northern border of these elevated states such as Arkansas, Tennessee, Oregon and North Carolina are also experiencing “low” levels. Montana and Washington are northernmost states that are experiencing elevated levels, reading at “high” and “moderate” respectively. Alaska, the US Virgin Islands and Guam are experiencing “moderate” levels. North Dakota is gray meaning “limited/no data.” Footer: "Source: CDC, Data Updated: 9/3/26, PeoplesCDC.org"

ALT Heading: "The Weather". Along with the “People’s CDC” logo. Body text: "The CDC-based wastewater map was updated on September 3 and depicts levels for the period from August 23 - 29. We can see increases in COVID levels across the country. According to the CDC, Texas is experiencing “Very High” levels, Montana, Arizona, Mississippi, and Hawaii are experiencing “High Levels” though the data from Montana and Mississippi are limited. A school district in San Antonio, Texas closed all campuses for two days just as the new school year began in an attempt to control the uncontrolled spread of COVID in the community. Regional trend data indicate the West has risen from “Low” to “Moderate.” The South has risen to “Low” with other regions remaining in “Very Low” but trending up. " Footer: "The Weather Report 09/07/26, peoplescdc.org"

ALT Heading: "West has risen to “moderate," South has risen to “low,” other regions remain “very low,” trending up." Along with the “People’s CDC” logo. A line graph, based on CDC’s data. Heading level one text: “COVID Wastewater Trends.” The y-axis is COVID concentration levels, from bottom to top, goes from “very low” to “very high.” The x-axis lists dates, from left to right, going from January 2026 through August 29, 2026. The line graph peaks in January 2026 - February 2026. From February 2026, and onwards, the line graph goes down. On August 1st levels in the South and West begin to trend up again. Currently the West is in “moderate” and the South is in “low” with the Midwest and Northeast in “very low” but trending towards “low.” Footer: "Source: CDC, Data Updated: 9/3/26, peoplescdc.org"

ALT Heading: "New COVID vaccines get FDA approval". Along with the “People’s CDC” logo. Body text: "The US Federal Drug Administration (FDA) has approved four new COVID vaccine formulations for the fall. These vaccines should be available in your local pharmacies soon if they are not already. Updated COVID vaccines have been repeatedly demonstrated to safeguard against severe illness and hospitalization in people of all ages, because COVID mutates and requires updated, targeted protection. The CDC’s official list of high-risk conditions is extensive and likely includes most Americans, so many under 65 are eligible for these shots and may not know it. Pharmacists may not be aware that “high risk” includes many conditions , so you should prepare for the potential discussion." Footer: "The Weather Report 9/7/26, peoplescdc.org"

ALT A data table labeled “COVID vaccines approved for fall 2026.” Moderna has created an mRNA vaccine called Spikevax that has full FDA approval for those ages 65 and up and approval for those aged 6 months to 64 years who have underlying conditions. Moderna has also created an mRNA vaccine called mNexpike that has full FDA approval for those ages 65 and up and approval for those aged 12 years to 64 years who have underlying conditions. Pfizer has created a vaccine called Comirntay that has full FDA approval for those ages 65 and up and approval for those aged 5 to 64 years who have underlying conditions. Novavax has created a protein vaccine called Nuvaxoid that has full FDA approval for those ages 65 years and up and approval for those aged 12 - 64 years who have underlying conditions. All of these vaccines were made to target the XFG variant. Footer: "The Weather Report 9/7/26, peoplescdc.org"

ALT Heading: "COVID infections are "Growing" or "Likely Growing" in 47 states." Along with “People’s CDC” logo. A map of the United States color-coded in shades of deep purple, purple, white and gray displaying the CDC COVID Model: Current Epidemic Growth Status based on emergency department visits as of September 2, 2026. Deep purple and purple tones indicate “Growing” and “Likely Growing”, deep teal and teal tones indicate “Declining” or “Likely Declining”, and white indicates “Not Changing.” States without predictions are represented in grey. The text above the map reads: “COVID Infections are Growing or Likely Growing or Likely Growing in 47 States.” Tennessee, Alabama and Georgia are colored purple to indicate “likely growing.” Louisiana and Mississippi are colored white for “not changing.” Iowa is colored grey for “not estimated.” All other states are colored deep purple for “growing.” Footer: "Source: CDC, Updated: 9/4/26, peoplescdc.org"
ALT Heading: "CDC Epidemic Trends" Along with the “People’s CDC” logo. Body text: " According to CDC Epidemic Trend data, there is a probability that the number of infections is “Growing” or “Likely Growing” at the state level nationwide, with the exception of Louisiana and Mississippi where it is “Not Changing.” Iowa is “Not Estimated.” We are in a wave and as schools continue to start up for the fall term, spread is likely to continue to grow. Please check out our Safer Gatherings Guide that can be used for class, work, back-to-school nights, and any other gathering you may attend." Footer: "The Weather Report 9/7/26, peoplescdc.org"

ALT Heading: "Two measles patients die in Pennsylvania" Along with the “People’s CDC” logo. Body text: "Recently in Pennsylvania, two infants who tested positive for measles have died, marking the first measles deaths in the country in 2026 and the first in Pennsylvania in 35 years. This comes as the measles outbreaks across the US continue to rage and RFK Jr. continues to downplay them. As such, RFK Jr. instructed the new CDC Director to remove these deaths from the CDC’s official tally. The Secretary, who has no medical or public health training, claimed the children had underlying conditions so they might have died with measles and not from measles. A tactic the federal government has grown quite comfortable using to minimize COVID deaths." Footer: "The Weather Report 9/7/26, peoplescdc.org"

ALT Heading: "Take Action!" Along with the “People’s CDC” logo. Body text: "Reject Medicaid work requirements and One Big Beautiful Bill. If you live in Arizona, California, Colorado, Connecticut, Delaware, the District of Columbia, Hawaii, Illinois, Maine, Maryland, Massachusetts, Michigan, Minnesota, Nevada, New Jersey, New Mexico, New York, Washington, Wisconsin, Kentucky or Pennsylvania, call and email your attorney general to voice your approval over their participation in Case No. 26-12962, the lawsuit against the implementation of Medicaid work requirements. If you reside outside of these states, call and email your attorney general to encourage them to join the lawsuit. Tell them to support Medicaid for All which would save both 114,000 lives per year and $1 trillion dollars per year." Footer: "The Weather Report 9/7/26, peoplescdc.org"

ALT Heading: “Get the WR in Your Inbox”. Along with the “People’s CDC” logo. Body text: "Access hyperlinks and read the full report on our website or subscribe to our Substack to receive the weekly report in your inbox: substack.com/peoplescdc Check out PeoplesCDC.org for more action items, petitions, and toolkits. With love, People’s CDC Weather Report Footer: "The Weather Report 9/7/26, peoplescdc.org"


ALT Heading: "High" levels in Texas and Mississippi" Subheading: "The Weather Report 8/24/26" A COVID wastewater map of the United States based on the CDC’s data. Heading level one text: “High” levels in Texas and Mississippi – “Moderate” levels in California, Hawaii, Guam and the U.S. Virgin Islands” Heading level two text: “COVID Wastewater Map.” Subheading text: “August 9 - August 15 2026.” On the map, the majority of the United States is in dark green, meaning “very low” viral activity levels. Washington, Arizona, New Mexico, Nevada, Arkansas, Louisiana, Alabama, Georgia, Florida, South Carolina, and New Hampshire are light green, meaning “low” levels. Guam, California, Hawaii, and the U.S. Virgin Islands are labeled yellow, meaning “moderate” levels. Texas and Mississippi are red, meaning "high" levels. North Dakota is gray meaning “limited/no data.” Footer: "Source: CDC, Data Updated: 8/20/26, PeoplesCDC.org"

ALT Heading: "West has risen to "low," south trending towards "low," other regions remain "very low"". Along with the “People’s CDC” logo. A line graph, based on CDC’s data. Heading level one text: “West has risen to “low,” “South trending toward “low,” Other regions remain “very low.” Heading level two text: “COVID Wastewater Trends.” The y-axis is COVID concentration levels, from bottom to top, goes from “very low” to “very high.” The x-axis lists dates, from left to right, going from December 2025 through August 15, 2026. The line graph peaks in December 2025 - February 2026. From February 2026, and onwards, the line graph goes down. Currently the West is in the “low” level with the South and National average still in “very low” but trending upward toward “low,” while the Midwest and Northeast remain “very low.” Footer: "Source: CDC, Data Updated: 8/20/26, peoplescdc.org"

ALT Heading: "The Weather". Along with the “People’s CDC” logo. Body text: "The CDC-based wastewater map was updated on August 20 and depicts wastewater levels for the period from August 9 through August 15. According to the CDC’s COVID Wastewater Viral Activity map, two states are experiencing “High” levels, four states and territories are experiencing “Moderate” levels, 12 states are “Low” and 34 states are experiencing “Very Low” levels. Notably, the data from WastewaterSCAN tells a very different story. It shows “High” levels throughout most of the country and “Medium” levels in the Midwest." Footer: "The Weather Report 8/24/26, peoplescdc.org"

ALT Heading: "According to WastewaterSCAN, "medium" levels in the midwest and "high levels in all other regions". Along with the “People’s CDC” logo. Graphic depicts a map of the United States separated into four regions: West, Midwest, South, and Northeast. A key in the lower right corner indicates wastewater concentration levels: orange for high, yellow for medium, blue for low, green for not detected, and gray for not calculated. The West, Southern, and Northeast regions are all shaded orange. The Midwest region is shaded yellow. There are individual wastewater treatment plants, indicated by dots, scattered across the map. The dots follow the same color key as regions. In the West, Southern, and Northeast regions, many dots are orange or yellow. In the Midwest dots are spread farther apart with a mix of blue, yellow, and orange dots. Footer: "Source: WastewaterSCAN, Data Accessed: 8/21/26, peoplescdc.org"

ALT Heading: "The Weather" Along with the “People’s CDC” logo. Body text: "Despite discrepancies between the CDC’s values and WastewaterSCAN’s, both the rise in wastewater elevation that we are seeing in Southern and Southwestern states in the CDC’s map and the “High” to “Moderate” levels in all regions in the WastewaterSCAN map seem as though they could indicate the beginnings of a late-summer wave. While COVID trends aren’t exactly the same each year, we can expect cases will continue to increase as the fall school term starts this month and next." Footer: "The Weather Report 8/24/26, peoplescdc.org"

ALT Heading: "Using wastewater data" Along with the “People’s CDC” logo. Body text: "This is a good reminder to also look for data coming from your most local wastewater facility. And that “Very Low” levels do not guarantee that you will not be exposed to SARS-CoV-2 or contract COVID in your area. Wastewater trends should be used as guidelines for when to increase precautions, with strategies such as cancelling events, avoiding large groups, or rescheduling certain postponable doctors’ appointments. Wearing a properly fitted N95/KN95/KF94 mask indoors and in crowded outdoor spaces, regular testing, and year-round masking policies at hospitals and nursing homes are baseline precautions that minimize viral transmission for everyone, and should be implemented at all levels of wastewater spread." Footer: "The Weather Report 8/24/26, peoplescdc.org"

ALT Heading: "COVID infections are "growing" or "likely growing" in 17 states". Along with the “People’s CDC” logo. A map of the United States color-coded in shades of purple, teal and gray displaying the CDC COVID Model: Current Epidemic Growth Status based on emergency department visits as of August 19, 2025, where purple tones indicate “Growing” or “Likely Growing”, teal tones indicate “Declining” or “Likely Declining”, and gray indicates “Not Changing.” States without predictions are represented in white. The text above the map reads: “COVID Infections Growing or Likely Growing or Likely Growing in 47 States Up.” South Dakota and South Carolina are colored light purple to indicate “likely growing.” Wisconsin is the only state colored white for “not changing.” Iowa and Georgia are colored grey for “not estimated.” All other states are colored purple for “growing.” Footer: "Source: CDC, Data Updated: 8/19/26, peoplescdc.org"

ALT Heading: "Epidemic Trends" Along with the “People’s CDC” logo. Body text: "According to CDC Epidemic Trend data, there is a probability that the number of infections is “Growing” nationwide, with the exception of South Dakota, South Carolina and Washington D.C. where the trend is classified as “Likely Growing,” in Wisconsin and Rhode Island where it is “Not Changing,” and in Georgia and Iowa where it is “Not Estimated.”" Footer: "The Weather Report 8/24/26, peoplescdc.org"

ALT Heading: "Take Action!" Along with the “People’s CDC” logo. Body text: "Reject Medicaid Work Requirements + One Big Beautiful Bill If you live in Arizona, California, Colorado, Connecticut, Delaware, the District of Columbia, Hawaii, Illinois, Maine, Maryland, Massachusetts, Michigan, Minnesota, Nevada, New Jersey, New Mexico, New York, Washington, Wisconsin, Kentucky or Pennsylvania, call and email your attorney general to voice your approval over their participation in Case No. 26-12962, the lawsuit against the implementation of Medicaid work requirements. If you reside outside of these states, call and email your attorney general to encourage them to join the lawsuit. Tell your attorney general to support Medicaid for All which would save both 114,000 lives per year and $1 trillion." Footer: "The Weather Report 8/24/26, peoplescdc.org"

ALT Heading: “Get the WR in Your Inbox”. Along with the “People’s CDC” logo. Body text: "Access hyperlinks and read the full report on our website or subscribe to our Substack to receive the weekly report in your inbox: substack.com/peoplescdc Check out PeoplesCDC.org for more action items, petitions, and toolkits. With love, People’s CDC Weather Report" Footer: "The Weather Report 8/24/26, peoplescdc.org"