

In crypto since 2017 | Alpha Research | Airdrops 🪂 | Trading
Access to alpha here 👉
Joined April 2023
- Tweets5.8K
- Following63
- Followers2K
- Likes4K




Almost everyone who bought $FIL over the past 5 years is underwater.
But here's what interests me.
The weekly chart shows price sitting near its historical lows after years of relentless selling.
My long-term targets:
$118.86
$237.39
$430.21
Yes, the full scenario implies over 36,000% upside.
Sounds insane.
And frankly, it would require an extraordinary comeback, not just a normal bull market.
I'm not saying $FIL will hit those numbers.
Old highs don't guarantee future demand.
But this is exactly the kind of chart I want on my radar when sentiment is completely dead.
Would you risk buying $FIL below $1?

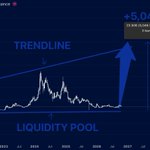
$RENDER at $1.71 might be one of the most overlooked AI plays right now.
Remember when everyone was screaming about AI being the future and buying $RENDER above $10?
Now it's sitting near a long-term accumulation zone, and suddenly nobody cares.
That's the part I find interesting.
The weekly chart shows a potential recovery setup, with a major trendline pointing toward $25.
A move of that size would mean roughly +5,046% from the chart's projected starting point.
Of course, a support zone isn't a guarantee of a bottom.
But if AI narratives return and $RENDER starts reclaiming key levels
I think people will be surprised how quickly sentiment changes.
Would you buy $RENDER before the hype returns?

$SEI at $0.05 looks like one of those charts everyone ignores until it's too late.
Years of selling.
Almost 95% down from its peak.
And now price is sitting right at a major historical support zone.
My upside targets if a reversal actually takes hold:
$0.39 → $0.73 → $1.14
The full scenario points to a potential +3,020% move.
I'm not saying $SEI will hit these levels tomorrow. But I wouldn't ignore a setup like this either.
Would you buy $SEI here or wait for confirmation?

$FET at $0.17 might be one of the craziest setups I'm watching.
Look at the weekly chart.
Years of price history, multiple massive rallies
and now we're back near the bottom of the entire range.
My long-term target? $7–8.
That's over 7,000% potential upside in this scenario.
Sounds ridiculous, I know.
But crypto has a habit of making the impossible look obvious in hindsight.
I'm watching this discount zone closely.
Would you hold $FET for a potential 40x?

$LUNC is down over 92% from its 2022 peak.
And somehow, this is exactly where things get interesting.
For years, everyone has been calling this alt dead.
Yet every time it looks completely forgotten, another speculative rally appears.
Now look at the weekly chart.
Price is sitting in a massive historical discount zone around $0.000045.
My bullish scenario? A recovery toward $0.0012.
That's a potential 3,100% move.
Am I saying it's guaranteed? Absolutely not.
$LUNC remains one of the riskiest bets in crypto.
But markets have a strange habit of reviving coins everyone has already buried.
And I'm not ignoring this setup.

$NEAR to $25? I think this chart deserves serious attention.
Look at what happened in 2022.
$NEAR collapsed from $20, spent years struggling to recover
and now it's testing a major descending trendline again.
The interesting part?
Buyers have been defending the long-term support zone for years.
We're sitting around $4.50
and a confirmed breakout could completely change the weekly structure.
My upside scenario points toward $25–$29.
That's potentially over 2,000%.
Sounds crazy until you remember how quickly altcoins can move when momentum returns.
I'm watching the $5–$8 region closely.
That's where I want to see real strength, not just another temporary pump.
Would you hold $NEAR all the way to $25?

Imagine selling $RENDER at $1.69 and watching it hit $25 a year later.
That would hurt.
What's interesting is that $RENDER has already shown
how aggressively it can move when the market gets excited about AI.
Now the weekly chart is sitting near a long-term support zone.
My bullish scenario? A recovery toward the $20–25 region.
That's an enormous move from current levels, but it would require a serious shift in momentum.
And here's my unpopular opinion:
The next big AI crypto rally might begin when everyone has completely stopped talking about AI alts.
I'm keeping $RENDER on my radar.

The market has practically buried $TIA.
From $21 to nearly $0.50.
That's the kind of collapse that makes people swear they'll never touch a coin again.
But I'm looking at the weekly chart and seeing a potential opportunity.
My recovery levels:
$3.31 → $9.24 → $21.05
And yes, the extreme scenario suggests 7,000% upside from the marked bottom.
Do I expect that tomorrow? Obviously not.
First, $TIA needs to break out of this endless downtrend and show that buyers actually have control.
But imagine ignoring it at $0.50 and suddenly getting interested again at $10.
Crypto investors have a strange talent for doing exactly that.

$ARB IS DOWN SO BAD THAT EVEN THE BEARS ARE GETTING BORED.
From above $2 to just $0.17.
Years of selling. Failed rallies. Almost zero excitement left.
But something caught my attention on the weekly chart.
Price is sitting near a long-term liquidity zone
and the downtrend is starting to look exhausted.
If buyers finally take control, I'm watching three levels:
$0.612 → $1.225 → $2.418
And in an extreme bullish scenario? The chart leaves room for a potential +4,574%.
Crazy? Sure.
But I think the bigger mistake would be ignoring $ARB completely just because everyone hates it right now.
The bottom isn't confirmed yet. That's what makes this interesting.

$LUNC has spent years trading near the bottom
with every rally eventually getting sold.
But look at the weekly chart.
We're sitting in a massive historical discount zone, and the potential upside is hard to ignore.
My levels:
$0.00020 - first major resistance
$0.000645 - previous major high
$0.00120 - aggressive bullish target
That final target represents a potential 30x+ move from current prices.
Do I expect it tomorrow? Absolutely not.
$LUNC is still extremely speculative, and this base could break.
But if buyers finally return, things could get interesting very quickly.
Everyone laughed at $LUNC after the crash. Would you give it another chance?

$XPL LOST 95% OF ITS VALUE.
NOW LOOK AT THIS.
From $1.69 to $0.075.
Almost everyone who bought the hype is underwater.
And that's exactly why this chart interests me.
Months of selling pressure, price completely crushed
and now $XPL is sitting near its historical lows.
I'm watching for signs that sellers are finally running out of steam.
My aggressive long-term target? $2.50.
That's a potential 35x+ from here.
Crazy? Absolutely. Guaranteed? Not even close.
But crypto has a habit of making the most ridiculous moves when nobody expects them.
Is $XPL dead, or is this where the next cycle begins?

Most traders have completely forgotten about $DASH.
And that's exactly why I'm watching it.
Look at the weekly chart.
Years of selling pressure, a massive liquidity zone below
and price still sitting near historical lows.
My upside targets:
$147.69
$284.98
$477.57
That final target represents over 3,000% potential upside from the measured base.
Sounds ridiculous? Maybe.
But crypto has a habit of making the most ignored charts interesting again.
I'm not expecting a straight line up.
This is an aggressive bull-market scenario, not a guarantee.
Would you hold $DASH for a potential 30x?

$NEAR spent years building a base
and now it's finally showing signs of strength.
My levels:
$3.26 - key support
$8.89 - first major resistance
$20.51 - previous cycle high
$30 - extended bullish target
I don't expect an easy ride.
There will be corrections, fakeouts, and plenty of fear along the way.
But if this structure plays out
$NEAR could deliver one of the most impressive comebacks of the next cycle.
I'm not ignoring this chart. Are you?

$SUI has already shown it can reach $5+.
Now it's trying to recover from a major accumulation zone.
My levels are $2, $4.43, and $5.36 before a potential push toward $7.50.
That's a possible 7x from here if the bullish scenario plays out.
I think $SUI could surprise a lot of people this cycle.
Are you holding?

$TAO to $1,500?
I think this chart is setting up for something massive.
Look at the weekly structure.
For almost two years, $TAO has been making lower highs while holding the same major support around $200.
Now we're approaching a point where that entire structure could finally break.
And if it does, I don't think $700 will be the final destination.
My long-term target is $1,500, with a potential +989% move measured from the chart's projected base.
Of course, we need confirmation above the descending trendline first.
But I've seen enough crypto cycles to know that the biggest moves often start when everyone has stopped paying attention.
Are we looking at another failed breakout or the beginning of $TAO's next major cycle?

$FET at $0.19. My long-term target?
$5.
Sounds ridiculous? Maybe.
But look at the weekly chart.
$FET has spent years bleeding out
and now it's sitting near a massive historical liquidity zone.
This is exactly where I'm watching for a major reversal.
My targets:
$0.98
$2.18
$3.46
$5.00 - Final bullish scenario (+4,207%)
Of course, none of this happens overnight
and the bottom isn't confirmed yet.
But I think the real opportunity is recognizing a potential reversal before everyone starts talking about it.

$LUNC is still holding its critical historical support zone.
That's what makes this chart interesting to me.
The previous ATH sits near $0.000645
while my extreme bullish scenario points toward $0.00125.
That's a potential +3,102% from the marked low.
Crazy? Absolutely. Guaranteed? Not even close.
But imagine watching $LUNC for years, only to miss the one recovery that actually matters.
Sometimes the most hated charts deserve the closest attention.
Make the hook more provocativeCut the generic market phrasing

$INJ at $8.49.
My target is $65.
Remember when everyone wanted $INJ above $40?
Now it's trading below $9, and suddenly nobody seems interested.
Funny how that works.
The weekly chart tells an interesting story.
A massive 92% correction from ATH
a sweep into the historical demand zone, and now signs of recovery.
My key levels:
$27.82 - first major checkpoint
$53 - previous ATH territory
$65 - my ultimate bullish target
That's a potential 1,610% upside from the marked bottom.
I'm not expecting a straight line up.
But I think the market is seriously underestimating what $INJ could do in another strong altcoin cycle.
The same people who ignored it at $4 will probably chase it at $40.

$STRK shows an extremely aggressive scenario toward $9.45.
Is it realistic?
That's a completely different question.
It would require a massive reversal, renewed demand, and favorable token supply dynamics.
I'm not calling the bottom yet.
But I'm watching $STRK closely.
Would you risk $100 on a potential 200x
knowing you could lose it all?

$SEI at $0.06. Remember when people were buying it above $1?
Crypto is a funny place.
Everyone wants a 10x
but nobody wants to buy when the chart looks like this.
I've been looking at the weekly structure
and $SEI is sitting near a major historical support zone.
My targets if momentum returns:
$0.3888 - first major resistance
$1.1419 - previous highs
+3,448% - the broader upside scenario marked on the chart
Of course, a cheap price doesn't automatically mean a bargain. Buyers still need to prove themselves.
But if $SEI starts reclaiming key levels, things could get interesting very quickly.
Would you buy $SEI here or wait for confirmation?
