

Free Predictions: https://teapawt.org/t.co/NEfyguBKql Learn About Predictology: https://teapawt.org/t.co/pZLuJf0v4V Coupon Code: Sorare Professional Trader | Sorare Manager | Footium Mgr
Online
Joined September 2016
- Tweets4.8K
- Following852
- Followers1.9K
- Likes715







A back four becoming a back five can tighten space, but it may also reduce attacking threat.
If live odds move from 2.40 to 2.10, check chance creation before calling it value. predictology.co/

1
169
At 1.70, relying on one star goalscorer for 45% of goals adds variance: a missed chance can move odds fast.
Test squad scoring depth, not just the headline name. predictology.co/

147
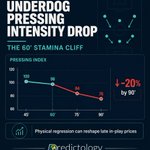
Underdog pressing can hit a stamina cliff after 60 minutes.
A late drop may reshape live prices: 2.10 before kick-off can become 1.85 when physical regression is visible.
Track the trend. predictology.co/

115
At 2–0, trailing pressure can rise while the leader’s defensive intensity drops.
A 2.00 price still reflects probability: not certainty.
Read the game state, not just the scoreline. predictology.co/

111
Heavy rain and strong winds distort passing metrics, dropping accuracy by up to 12%.
Poor conditions frequently trend goal totals below market expectations.
Analyse weather data. predictology.co/

103
The new manager bounce is often exaggerated by media narrative.
Data shows regression to baseline performance within 5 matches.
Do not overpay at 1.85 odds. predictology.co/

94
Tactical fouls disrupt momentum, altering live markets.
Data shows 64% of tactical yellow cards reset high-value transitions, mispricing bookings at 1.85.
Analyse patterns. predictology.co/

92
Over 28% of goals occur post-80th minute as fatigue sets in.
Backing late markets at 2.10 requires robust data models. predictology.co/

106
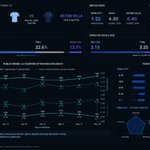
Public money often drives odds on short favourites too low. When favourites face disciplined counter-attacking sides priced at 3.50+, value emerges. Analyse metrics, not hype. predictology.co/

1
101
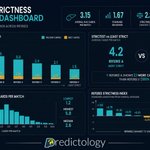
Not all officials interpret rules equally.
Factoring referee-specific card averages into your match models uncovers hidden value in booking markets.
Analyse the data. predictology.co/

1
85
Set-piece conversion rates almost always regress over time. Teams overperforming from dead-ball situations early on rarely sustain those figures. Always examine underlying metrics. predictology.co/

1
80
Different officials interpret rules with distinct thresholds. Factoring referee booking averages into your match models uncovers hidden value in card markets. Analyse the data. predictology.co/

87
Set-piece conversion rates almost always regress.
Teams that overperform from dead-ball situations early on rarely sustain those numbers.
Always analyse underlying data. predictology.co/

81
An early goal spikes live betting totals.
Markets often overreact, mispricing lines.
Look past the early strike and analyse underlying metrics before backing overs. predictology.co/

84
High possession does not equal high xG efficiency.
Teams dominating the ball often fall into sterile passing traps, while direct counter-attacking sides create quality chances. predictology.co/

96
Local derbies throw form books out of the window.
Historical data shows goal variance spikes in rival clashes, making standard pricing unreliable.
Re-analyse underlying metrics. predictology.co/

79
Markets overreact to injuries, driving odds wide (e.g. 2.40).
Squad depth & tactical continuity mean elite sides maintain performance output.
Model true impact. predictology.co/

97
Long clean sheet runs often mask underlying defensive vulnerability.
Markets routinely overprice teams after 4+ matches without conceding.
Regression is inevitable.
Analyse the real metrics. predictology.co/

78
Public home bias frequently undervalues disciplined away sides.
When compact defensive structures meet complacent hosts, away odds at 3.40 offer real value. predictology.co/

102
Yellow card suspension thresholds alter defensive intensity.
Players near suspension show measurable drops in tackle frequency to avoid bans.
Model this tactical shift. predictology.co/

1
116