

I trade $NQ using statistical models, probabilistic frameworks, and custom tools built based on my market perspective. Creator of https://xitter.cf/t.co/fGgQW2fYLP
Joined November 2016
- Tweets5.9K
- Following153
- Followers7.8K
- Likes4.7K



Pinned Tweet
I started clicking buttons on charts in 2007. In that time, I have learned that there is no "best strategy", there is just how you view the market, and what edge you can extract from those views.
Edge generates alpha. Process allows the edge to be utilized. Performance comes from your ability to follow your process.
My coding/math brain gravitated towards a statistical approach, which overtime lead to creating various concepts, frameworks, and ideas. nqstats.com is a free resource I created to catalog some of those things.
If you want to see a stop to specific individuals fraud, deceptive marketing tactics, scams, etc., that is exactly what the Federal Trade Commission (@FTC) is for. Only takes a few minutes to make a report.
File a report here:
reportfraud.ftc.gov/
CSV Exporter for Ninja Trader
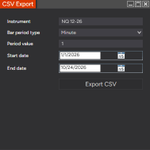
Here is a data export tool I made. Import it like you would an indicator (Tools > Import > Ninjascript Add-On). To use it, go to main control center window and click "New". Scroll down and select the CSV Export.
You can export any data you want. Select the asset, bar type, bar value, and date range.
This will spit out a CSV file in C:\Users\name\Documents\NinjaTrader 8\CSV Exports
Now you don't have to pay $100's of dollars for CSV data files from places like Data Bento.
Download:
drive.google.com/file/d/1bcC…


Hey @AnthonyCrudele and @NTLiveMedia, yall might want to look into this. Im sure you dont want someone on your livestream who is blatantly misleading and lying to the masses.

i try my absolute best to stay out of drama but this is fucking gold
@lanto_trades posted yesterday he made $500k after only buying 40 accounts with vest. edited the account names to reflect 40-50ish.
then accidentally uploads the uncropped screenshot of account 819. deletes. reuploads the cropped version.
you too can probably make $500k after 819 yolos.


Took a long vacation, realized I really do not have any interest in this platform from a FinX standpoint anymore. Over the last few years, the increase in sim firms, the gamification of trading, the increase in immature young "traders", etc. This platform just isn't what it was a few years ago. Before anyone says "accept the change grandpa", I have, its just not for me.
Will be dialing back my engagement alot, probably wont be posting much. Always here to help those seeking profitability, just shoot me a DM.
Someone help this guy out. I dont use TradingView and everything you all code is for TradingView lol.

Which TBR indicator do you suggest we use? The one by @notprofgreen has different levels than all the other ones on the website.
Chris™ retweeted
On nqstats.com you will see two sections in the menu;
Stat Library:
Collection of concepts, each one starting as an individual hypothesis. The statistical data is the edge, you provide the execution.
Frameworks:
Structured approaches to solving problems and organizing analysis. The lens the market is viewed through.
The Stat Library gives you validated, individual truths about price behavior; Frameworks tell you how to read those truths together and act on them.
So you want to build a strategy, but are not sure where to source inspiration or ideas from? Here are some top sources I have found overtime. Many of these will provide full strategy parameters, some will spark ideas, some will simply teach you things you didn't know.
SSRN (ssrn.com)
A main home for academic finance papers, free to read. Search specific keywords for things of interest.
arXiv (arxiv.org/archive/q-fin)
A main home for academic finance papers, free to read. Search specific keywords for things of interest.
Concretum Group (concretumgroup.com/papers)
The authors have published several intraday papers on various things including opening range breakout and intraday momentum.
Ernie Chan's blog (epchan.blogspot.com)
Free posts on mean reversion and momentum from a well known quant.
Quantocracy (quantocracy.com)
A daily aggregator of quant blog posts. Good way to discover new authors.
QuantConnect (quantconnect.com/research)
Research articles written by various traders sharing ideas, strategies, and concepts.
Unger Academy (ungeracademy.com/blog)
Free articles from a well known futures systematic traders covering strategy breakdowns and concepts.
Robot Wealth (robotwealth.com/blog)
Free practical, code driven articles.
Alvarez Quant Trading (alvarezquanttrading.com/blog…)
Free blog with tested equity and futures ideas.
Explain to me the difference between buying and selling a few years later…..vs…..buying and selling a few minutes later?
Why is one gambling and one investing? The definition of investing is buying an asset with the expectation it will appreciate in value overtime. “Overtime” doesnt mean years, it means overtime….could be 5 years, could be 5 minutes.
People are quick to call day trading “gambling” because it removes the accountability from their failure of not being able to follow a process and control their emotions.


What is also interesting, aside from seeing the Out-Of-Sample YTD hit rate holding its baseline 10yr repeatability, is the YTD MAE profile holding relatively the same as well. Attached, for example, is the MAE profile from 2016-2025 for +0.25 reverted events as already on nqstats.com/am_tbr. Also attached is the YTD +0.25 reverted events MAE profile. Nearly the same.


The "AM TBR" stats at nqstats.com/am_tbr were derived from 10yrs spanning 2016-2025, but how have those baselined 10yr metrics held up so far in 2026?
+0.25 hits during the 8am hour have a 10yr baseline of 78.4% reversion back to TBR open. So far ytd it is pulling 85.5% with the last 10 events giving 80%. So performing slightly better than the 10yr baseline, with the occasional under/over performance.
-0.25 hits also performing slightly better than the 10yr baseline, with the baseline at 79.6% and the ytd at 86.9%, with the last 10 events at 90%.
What does this mean? It means the statistic wasn't noise or luck of sequence, this invalidates the random walk hypothesis by out of sample showing validity and "near same" numbers from the original test. There is repeatability here that has lasted beyond the initial test.

This morning was a pure test of patience for me. 100% favored longs before the open given the imbalance to the downside both from a current day and historical perspective, mean reversion up just seemed like the obvious play......but...... that prior week low just below is always a magnet in these scenarios, so couldn't justify front running that PWL grab, NY equity open could of easily made a 100pt run for that low like it does often.
Waited through all the chop, had FOMO the entire time, walked away a few times to get rid of the FOMO and waited for IB to close. Took a long on the pullback and snagged +1.5r. A lot of waiting but it paid off.

I have no affiliate links, because I do not use props or any third party services/tools, thus I have nothing to promote as I wouldn't promote something I do not use. I have turned down 8 affiliate/partnership offers in the last 12 months according to my DM history.
...Am I doing it wrong???
The "AM TBR" stats at nqstats.com/am_tbr were derived from 10yrs spanning 2016-2025, but how have those baselined 10yr metrics held up so far in 2026?
+0.25 hits during the 8am hour have a 10yr baseline of 78.4% reversion back to TBR open. So far ytd it is pulling 85.5% with the last 10 events giving 80%. So performing slightly better than the 10yr baseline, with the occasional under/over performance.
-0.25 hits also performing slightly better than the 10yr baseline, with the baseline at 79.6% and the ytd at 86.9%, with the last 10 events at 90%.
What does this mean? It means the statistic wasn't noise or luck of sequence, this invalidates the random walk hypothesis by out of sample showing validity and "near same" numbers from the original test. There is repeatability here that has lasted beyond the initial test.

