

Open source project: Set of libraries to visualize runtime data related to Processes (defined as BPMN Diagram), Humans, Robots and Systems
Grenoble
Joined September 2020
- Tweets145
- Following101
- Followers103
- Likes21




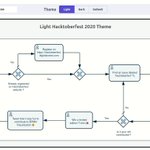


📣 bpmn-visualization 0.45.0 is out! 🎉
This new version renders annotations and associations defined in the “collaboration” nodes of the BPMN source.
#bpmnvisualization #bpmn #visualization #typescript #opensource
github.com/process-analytics…

📣 bpmn-visualization 0.44.0 is out! 🎉
This new version of bpmn-visualization introduces a reduction in package size.
#bpmnvisualization #bpmn #visualization #typescript #opensource
github.com/process-analytics…
📣 bpmn-visualization 0.42.0 is out! 🎉
This new version brings improvements to the ShapeBpmnSemantic data returned by the API. There are now more details for Link Events.
#bpmnvisualization #bpmn #visualization #typescript #opensource
github.com/process-analytics…

📣 bpmn-visualization 0.41.0 is out! 🎉
Provides more information in the ShapeBpmnSemantic objects returned by the APIs.
#bpmnvisualization #bpmn #visualization #typescript #opensource
github.com/process-analytics…

September 2023 Update: We're ready for #hacktoberfest2023! Check out our new features and the latest updates on our demos and tools. medium.com/@process-analytic…
Exciting news! 🎉 We're back for #Hacktoberfest ! If you've got a passion for #OpenSource, let's join forces. Dive into #visualization and #processanalytics with us. Check out our hacktoberfest tagged issues to see where you can contribute! github.com/issues?q=is%3Aiss…

Hacktoberfest 2023 is nearly here! Check out the site to learn more about what to expect this year, from the change in rewards to hosting community events and participating in Hacktoberfest: hacktoberfest.com

📣 bpmnVisualizationR 0.5.0 is out! 🎉
This new version allows you to style the BPMN elements of the displayed diagram.
#bpmnvisualization #bpmn #visualization #R #RLang #programming #opensource
github.com/process-analytics…

📣 bpmn-visualization 0.40.0 is out! 🎉
This new version brings improvements to the `incoming` and `outgoing` properties of `BpmnSemantic` objects returned by APIs.
#bpmnvisualization #bpmn #visualization #typescript #opensource
github.com/process-analytics…

Process Analytics retweeted

📣 Announcing a new release of #maxGraph, a TypeScript library which can display and allow interaction with vector diagrams. The #mxGraph successor. cc @Coclav @ProcessAnalyti1
This new version introduces the Manhattan connector 👇
user-images.githubuserconten…
github.com/maxGraph/maxGraph…
📣 bpmn-visualization 0.39.0 is out! 🎉
Improves the usability of BPMN diagrams by providing a new API for obtaining model elements, and includes various bug fixes.
#bpmnvisualization #bpmn #visualization #typescript #opensource
github.com/process-analytics…

📣 bpmn-visualization 0.38.1 is out! 🎉
This new release focuses on maintenance.
#bpmnvisualization #bpmn #visualization #typescript #opensource
github.com/process-analytics…

Our July update is here ⛵! It introduces an experimental library for computing paths in #BPMN, along with a fresh demo visualizing runtime prediction. Find out all the details here👉 medium.com/@process-analytic…
📣 bpmn-visualization 0.38.0 is out! 🎉
Brings improvements to the styling feature, a new demo, and a new experimental library.
#bpmnvisualization #bpmn #visualization #typescript #opensource
github.com/process-analytics…

Diving into bpmn-visualization #Typescript library 🏊 In this article we focus on style management, with resources for beginners and advanced usage scenarios. Check it out here: medium.com/@process-analytic… #tutorial #BPMN #visualization

Process Analytics retweeted
📣 Announcing a new release of #maxGraph, a TypeScript library which can display and allow interaction with vector diagrams. The #mxGraph successor.
github.com/maxGraph/maxGraph…
cc @Coclav @ProcessAnalyti1

Explore highlights from recent webinars, get to know our new APIs, and learn about our community's contribution to integrating bpmn-visualization with the #Vue framework. Check out the details👇
medium.com/@process-analytic…
#news #BPMN #visualization #ProcessAnalytics

📣 bpmn-visualization 0.37.0 is out! 🎉
This new version provides a new API for resetting the entire style of BPMN elements.
#bpmnvisualization #bpmn #visualization #typescript #opensource
github.com/process-analytics…
📣 bpmn-visualization 0.36.0 is out! 🎉
Brings enhancements to BPMN support, documentation updates, external contributions from community members.
#bpmnvisualization #bpmn #visualization #typescript #opensource
github.com/process-analytics…

Discover the latest updates in our May monthly news by Process Analytics, including new APIs and support for 'BPMN in color' 🌈. Read more at: medium.com/@process-analytic…
#news #bpmn #visualization
📣 bpmn-visualization 0.35.0 is out! 🎉
This new version introduces support for "BPMN in color" and dependency changes.
#bpmnvisualization #bpmn #visualization #typescript #opensource
github.com/process-analytics…
