

Mapping the world with Python. Buy my book here - https://xitter.cf/t.co/hAaaAxtIO9
Planet Earth
Joined January 2021
- Tweets2.3K
- Following524
- Followers77.5K
- Likes8K




Trying my hand at infographics. Mapping maritime choke points. Unfortunately the publicly available data used to produce this was recorded between 2015 and 2021 - Prior to the Houthis actions in the Red Sea and the war in Iran, which no doubt change this picture.

I am excited to be representing @SynMaxInt at the #EsriUC2026. If anyone is attending and wants to discuss maps or ships, please get in touch,
Forest Loss. This map shows forest loss since 2000 in Africa. Defined as a stand-replacement disturbance, or a change from a forest to non-forest state.

Forest Loss. This map shows forest loss since 2000 in South America. Defined as a stand-replacement disturbance, or a change from a forest to non-forest state.

Forest Loss. This map shows forest loss since 2000 in Asia. Defined as a stand-replacement disturbance, or a change from a forest to non-forest state.
For those who care - projection is EPSG:27703 is WGS 84 / Equi7 Asia

Forest Loss. This map shows forest loss since 2000 in Oceania. Defined as a stand-replacement disturbance, or a change from a forest to non-forest state.

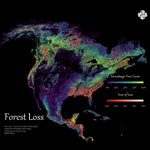
Forest Loss. This map shows forest loss since 2000 in North America. Defined as a stand-replacement disturbance, or a change from a forest to non-forest state.

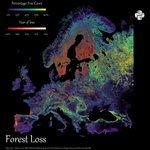
Forest Loss. This map shows forest loss since 2000 in Europe. Defined as a stand-replacement disturbance, or a change from a forest to non-forest state.

This bivariate map uses WRI's Aqueduct 4.0 data to show projected gross water demand (white→orange) vs. blue water availability (blue→purple) under a business-as-usual scenario by 2065–2095.

This bivariate map uses WRI's Aqueduct 4.0 data to show projected gross water demand (white→orange) vs. blue water availability (blue→purple) under a business-as-usual scenario by 2065–2095.

This bivariate map uses WRI's Aqueduct 4.0 data to show projected gross water demand (white→orange) vs. blue water availability (blue→purple) under a business-as-usual scenario by 2065–2095.

This bivariate map uses WRI's Aqueduct 4.0 data to show projected gross water demand (white→orange) vs. blue water availability (blue→purple) under a business-as-usual scenario by 2065–2095.

This bivariate map uses WRI's Aqueduct 4.0 data to show projected gross water demand (white→orange) vs. blue water availability (blue→purple) under a business-as-usual scenario by 2065–2095.
For those who care - projection is EPSG:27703 is WGS 84 / Equi7 Asia

This bivariate map uses WRI's Aqueduct 4.0 data to show projected gross water demand (white→orange) vs. blue water availability (blue→purple) under a business-as-usual scenario by 2065–2095.
Inspiration came from this post from @Esri - esri.com/arcgis-blog/product…

