

The world runs on resources. I analyze them. Weekly map on Substack. Not financial advice.
Joined December 2021
- Tweets1.2K
- Following153
- Followers7.8K
- Likes635





Pinned Tweet
This is one of the cleanest multi-year setups in the entire commodity space.
Look at the Bloomberg Commodity Index.
A massive cup-and-handle pattern stretching back over a decade is now pressing against resistance near 138.
If this breaks and holds, it won’t be a quiet move.
History shows these kinds of structures on the broad commodity complex tend to unleash a powerful, multi-month wave higher across energy, metals, and softs.
That means:
• Sticky inflation returning through the physical cost of living
• Central banks trapped between rising prices and soaring debt costs
• Accelerating capital rotation out of paper assets into real ones
The paper narrative of “cooling inflation” is about to collide with physical reality.
The breakout, if confirmed, changes the entire macro regime.
Physics > Paper.

$Gold is sitting on a level that actually matters right now. Hold this support and the structure stays intact. Break it and metals risk becoming a source of liquidity instead of protection.
At the same time the Gold/Silver ratio just tagged the exact zone I’ve been tracking, Silver is finishing a large cup-and-handle retest near $51, and the put-call skew shows the street is already heavily positioned for more downside.
One relative chart has already failed, so the setup is no longer clean. Still, if these levels hold, the risk-reward remains asymmetric to the upside.
Full breakdown of the levels and what I’m watching next is in this week’s note (free). Link in the comment.

Full Sunday note (free): resourcealpha.substack.com/p…
• Gold at key support
• Gold/Silver ratio decision point
• Silver cup-and-handle retest
• Put-call skew + extreme sentiment
• Why Silver/SPX is currently the weak link
No paywall. Just the charts.
Do you really think governments would let private companies produce synthetic gold cheaply?
If it was actually scalable, they would be doing it in secret right now to stay the most powerful.
Anyone who thinks they would allow this to go public is extremely naive.
We’ve seen this story many times before in history.
$Silver is at $55 and still falling.
Next major support is around $51 — only about 7% lower.
That’s the old multi-decade ceiling that flipped into strong support.
Do you really want to sell your silver stocks this close to that level?

Are you sure you’re not missing the energy bull run?
Oil just printed a clean weekly bullish engulfing right off structure.
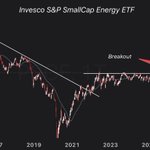
Small-cap energy (PSCE) broke multi-year resistance and is now retesting it. A bounce here would confirm the market is treating higher oil as a new trend — not a short-term reaction to Trump tweets.
Gas equities (FCG) are breaking a multi-year inverse head-and-shoulders.
XLE is also breaking out relative to the S&P 500.
Energy is starting to move as a complex, not as a single headline asset.
The open question is metals. The Gold/Silver ratio is retesting major multi-year resistance. What happens next will decide whether this stays energy-led or broadens into a full commodity rotation.
I laid out the full map (with charts) here — free for now:
resourcealpha.substack.com/p…

Has it already started?
While the indices are getting sold, oil miners are confirming the move and metals refuse to roll over.
Hard assets are holding structure. Paper is not.
Physics > Paper.

Yesterday’s CPI panic on gold lasted exactly one session before Asia stepped in and bought the dip. The flood of bearish gold headlines yesterday speaks for itself.
CPI just printed hot. If you’re holding gold and silver miners, here’s what it actually means.
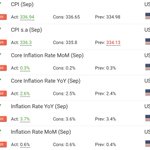
September inflation came in at 3.7% YoY, core also hotter. The United States remains trapped. The only realistic path to manage the debt is to inflate it away. That process is positive for metals over the long run - and by extension for the miners that produce them.
Short term it can look messy. Hotter data can push capital back into the dollar and create temporary pressure on the metal and the stocks. That is normal in this regime. It does not invalidate the structural setup.
I’ve been writing about this inflation path from the start of the channel. The data keeps confirming it. The thesis stays the same.

Gold sentiment is tragic.
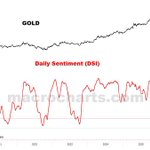
People are drawing 40% crashes while the metal is still in a primary bull market. The Daily Sentiment Index is washed out. That is not a reason to sell. That is the noise that creates the entry.
Are you using this window to add, or are you listening to people drawing arrows to the floor?


Gold and silver juniors look ready to outperform.
Metals just took another wave of selling. Juniors sold off with them. They just did not sell off the way they normally do when the metal drops.
$GDXJ and $SILJ broke the wedges, retested the zone, and closed last week with demand candles. The ratio charts are holding the lines they just cleared. That is not how juniors behave in a normal pullback.
Here is why I treat this as a great accumulation window:
resourcealpha.substack.com/p…

Food, fuel, and metal just cleared a 10-year ceiling. Almost nobody noticed.
I treat this consolidation as accumulation.
The Bloomberg Commodity Index just completed the retest of a breakout from a massive cup and handle. Cup from 2015, low in 2020, handle through 2022–2025. The 138 line capped the range. Price broke it, came back to it, and did not give it up.
This is not a stock basket. BCOM tracks futures on physical commodities: oil, gas, gold, silver, copper, corn, soy, wheat. The stuff the economy actually burns and eats.
Above 138 the structure holds. A move back under the line kills it. That is the level I am using.
When this basket breaks and holds, inflation stops being a headline and starts showing up in the bill.
Physics > Paper.


This is one of the cleanest multi-year setups in the entire commodity space.
Look at the Bloomberg Commodity Index.
A massive cup-and-handle pattern stretching back over a decade is now pressing against resistance near 138.
If this breaks and holds, it won’t be a quiet move.
History shows these kinds of structures on the broad commodity complex tend to unleash a powerful, multi-month wave higher across energy, metals, and softs.
That means:
• Sticky inflation returning through the physical cost of living
• Central banks trapped between rising prices and soaring debt costs
• Accelerating capital rotation out of paper assets into real ones
The paper narrative of “cooling inflation” is about to collide with physical reality.
The breakout, if confirmed, changes the entire macro regime.
Physics > Paper.
If $SILVER has you uneasy, look at the chart before the feed.
The correction did its job. Price broke the falling wedge and is now sitting on the line it just cleared. That is a textbook retest, not a breakdown. As long as we hold above that upper boundary, the breakout is intact.
A drop back through the line changes the picture. Then 51 is back on the table. That is the level, not a reason to panic while price is still holding the retest.

Yesterday, in the Sunday note, I wrote that the EWZ retest looked done. Today the market gapped it 13%.
EWZ had just finished a retest of a wedge that held it for the better part of two decades. I said the move from there was higher.
The trigger was the first round. Flávio Bolsonaro finished ahead of Lula, 47% to 45%. Markets were set up for the other result. That is a gap, not a slow grind out of the retest.

Energy still looks like the optional part of this move. I don’t buy that.
Oil priced in gold is sitting in a box after breaking a line that held it down since 2023. Gas priced in gold is on a floor that has caught it for ten years. The barrel ran through 100 and is coming back into the breakout.
The charts don’t show the barrels in storage. The US reserve is at 283.8 million, the lowest since 1982. The IEA already let out 400 million in March. On October 2 the G7 agreed another 100 million.
A stockpile you keep opening is not a ceiling. You are spending it.
Charts are in the note: resourcealpha.substack.com/p…

One of the most bullish charts out there right now.
A gigantic inverse head and shoulders just completed on the $FCG First Trust Natural Gas ETF. Left shoulder 2016. Head in the 2020 washout. Right shoulder into 2025. Neckline near 30 — broken.
We are very early in this structure. The base took a decade to build. The breakout is weeks old.

Silver/SPX already broke the 10-year resistance line.
Then price coiled in a bullish wedge. The downside break of that wedge looks like the possible fakeout I flagged in Sunday’s note — not automatically a new downtrend.
Base case now: finish the retest of the old 20-year ceiling, now support, and turn higher.
If this line is lost, metals get more downside. That is the lower-probability path — not zero.
Sitting in cash and waiting for a deeper wash is still the expensive side of this chart. If the ratio leaves this line, you chase. If it tags it again, the damage is the kind you can live with.
Sunday note (free):
resourcealpha.substack.com/p…
