




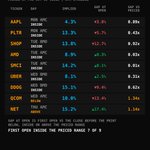




ALT Table called Earnings Week Nov 2 to 6, nine companies in report order. For each: Oct 30 close, the straddle's priced move for the coming report, mean implied move across its 8 prior prints, a count of how those 8 first opens fell (under, within or over each straddle's range), and its mean absolute close move on those prints. AAPL Mon after close 344.63, 4.3%, 4.0%, 1 7 0, 2.5%. PLTR Mon after close 184.11, 13.3%, 12.1%, 0 4 4, 14.8%. SHOP Tue pre open 157.49, 13.8%, 12.4%, 0 5 3, 11.6%. AMD Tue after close 504.80, 8.9%, 8.2%, 2 5 1, 8.8%. SMCI Tue after close 32.95, 14.2%, 15.4%, 2 6 0, 13.6%. UBER Wed pre open 65.25, 8.1%, 7.3%, 1 7 0, 5.5%. DDOG Wed pre open 235.27, 15.1%, 11.3%, 1 5 2, 12.2%. QCOM Wed after close 164.79, 10.0%, 6.9%, 1 6 1, 6.3%. NET Thu after close 280.70, 15.2%, 11.7%, 1 7 0, 10.1%. Footer @SPXVIX.


ALT Horizontal bar chart titled "Mega caps vs their all time highs", as of the October 29 close, showing each stock's percent change from its all time high. GOOGL -30.5%, AVGO -30.3%, META -21.6%, TSLA -19.2%, AMZN -15.1%, NVDA -12.2%, MSFT -4.6%, S&P 500 -1.6% (highlighted in blue, with a blue reference line at its level), AAPL -0.8%.


ALT Table "Earnings Week 10/26-10/30", card 1 of 2, 11 companies reporting this week, by day, before open (BMO) then after close (AMC). Each row: Friday 10/23 close; implied move for this print from the at-the-money straddle; average implied move over the last 8 prints; first open after those 8 prints below/inside/above the priced range; average absolute close-to-close move. VZ Mon BMO: 44.66, 4.4%, 4.2%, 0/7/1, 4.0%. KO Tue BMO: 92.71, 3.3%, 2.9%, 1/3/4, 2.8%. BA Tue BMO: 188.35, 5.7%, 5.0%, 0/7/1, 3.7%. GLW Tue BMO: 123.69, 9.2%, 7.7%, 1/5/2, 6.2%. V Tue AMC: 407.92, 3.4%, 3.4%, 0/6/2, 2.3%. STX Tue AMC: 630.49, 9.9%, 9.4%, 1/5/2, 10.2%. GOOGL Wed AMC: 320.21, 6.1%, 6.2%, 2/5/1, 4.1%. MSFT Wed AMC: 524.51, 5.2%, 5.1%, 2/3/3, 7.0%. NOW Wed AMC: 158.96, 10.3%, 8.6%, 3/3/2, 8.8%. FTNT Wed AMC: 179.99, 12.0%, 10.5%, 2/5/1, 9.4%. LLY Thu BMO: 1273.46, 6.6%, 6.3%, 3/5/0, 8.0%.

ALT Table "Earnings Week 10/26-10/30", card 2 of 2, 10 companies reporting this week, by day, before open (BMO) then after close (AMC). Each row: Friday 10/23 close; implied move for this print from the at-the-money straddle; average implied move over the last 8 prints; first open after those 8 prints below/inside/above the priced range; average absolute close-to-close move. MA Thu BMO: 623.60, 3.6%, 3.0%, 1/7/0, 2.3%. MRK Thu BMO: 145.27, 5.2%, 5.0%, 1/7/0, 2.4%. CAT Thu BMO: 687.00, 7.8%, 5.3%, 1/4/3, 4.8%. BMY Thu BMO: 61.48, 5.5%, 4.7%, 0/8/0, 4.3%. MO Thu BMO: 74.31, 4.0%, 3.6%, 2/5/1, 5.4%. AMZN Thu AMC: 248.00, 7.9%, 7.1%, 2/3/3, 6.2%. INTC Thu AMC: 86.96, 9.9%, 9.8%, 3/4/1, 9.3%. XOM Fri BMO: 183.21, 3.9%, 2.4%, 0/7/1, 1.1%. ABBV Fri BMO: 285.64, 4.8%, 4.4%, 1/6/1, 3.5%. CVX Fri BMO: 233.21, 3.9%, 2.5%, 0/7/1, 2.4%.


