

A new way to explore, visually communicate and make sense of data.
Joined April 2021
- Tweets293
- Following40
- Followers845
- Likes73




SCImago Graphica retweeted
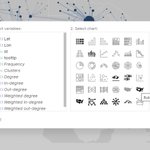
Just a few visualizations that have been added or updated in the visualization catalog graphica.app/catalogue/


Just a few visualizations that have been added or updated in the visualization catalog graphica.app/catalogue/
SCImago Graphica retweeted

After months of hard work in the laboratory, data collection, and exhaustive analysis, your manuscript is ready. However, you face one of the most important decisions in any researcher’s career: 🔎In which scientific journal should you publish?
Maximize the impact of your research. In this article, we break down the key criteria and a 7-step methodology to help you achieve maximum visibility for your research.
Explore how to navigate SJR quartiles, avoid predatory publishers, and select the best home for your manuscript. 📈
👉 Read the full guide here: scimagolab.com/how-to-select…

SCImago Graphica retweeted
SCImago Graphica 2.0 is here, now 100% in your browser 🎉
No install, no account, and your data never leaves your device.
New Chart Advisor, a catalogue of 40+ ready-to-use visualizations and a redesigned interface.
👉 graphica.app

SCImago Graphica retweeted
SCImago Graphica evolves to version 2.0 and transforms into a web application! 🚀🌐
We are taking a step forward with a much more expressive and stable graphics engine, available directly from your browser with no installation or login required.
Key new features:
🎨 Redesigned interface: More intuitive.
🧭 Chart Advisor: Upload your dataset and it suggests the ideal visualizations for your data, ready for editing.
📊 Catalog of 42 renewed visualizations: Alluvial diagrams, temporal networks, cartograms, sunbursts, and more.
✨ Expanded graphic grammar: Waffle charts, new cartograms, data-anchored annotations, and accessible color palettes.
📘 20-chapter manual: Comprehensive guides from dataset preparation to maps, networks, and clustering.
💾 Were you using the desktop version? You can open your .gph projects in the new version without losing anything.
We invite you to try it at:
🔗 graphica.app
@ScimagoGraphica


SCImago Graphica 2.0 is here, now 100% in your browser 🎉
No install, no account, and your data never leaves your device.
New Chart Advisor, a catalogue of 40+ ready-to-use visualizations and a redesigned interface.
👉 graphica.app
SCImago Graphica 2.0 is here, now 100% in your browser 🎉
No install, no account, and your data never leaves your device.
New Chart Advisor, a catalogue of 40+ ready-to-use visualizations and a redesigned interface.
👉 graphica.app
SCImago Graphica retweeted

✨Meet Scimago Graphica
@ScimagoGraphica It’s very easy to use, freely accessible.
Read my article on Medium
🔗 medium.com/@vespinozag/meet-…
👇Take a look at a set of visualizations I created
#NetworScience #Datavisualization #DataScience #OpenAccess #phdchat #AI #Marketing #UX
SCImago Graphica retweeted

New look. New structure. Same commitment to trusted metrics. We’ve just launched the redesigned #SJR, created with @solublestudio to make scientific journal and country data clearer, more accessible and easier to navigate. Take a look at scimagojr.com!


SCImago Graphica retweeted
Retractions in Latin America reveal how the “publish or perish” culture shapes science — and sometimes compromises #integrity. Our latest piece explores what’s behind these numbers and what they say about #research systems in the region bit.ly/3LEvnk6 #OpenScience


SCImago Graphica retweeted
Using @retractionwatch and @Scopus as sources, this is the percentage of retracted output by country and region. It must be fantastic to be a researcher or editor in scientific domains where almost no one ever makes a mistake.🙋


SCImago Graphica retweeted
The Power of Small Multiples
In his article “From good to great: redesigning a sausage chart” @Koen_VdE shows in a practical way how to improve a chart to communicate its message more clearly and understandably...
reddit.com/r/ScimagoGraphica…

The Power of Small Multiples
In his article “From good to great: redesigning a sausage chart” @Koen_VdE shows in a practical way how to improve a chart to communicate its message more clearly and understandably...
reddit.com/r/ScimagoGraphica…
SCImago Graphica retweeted
It is now possible to identify non-APC (diamond) journals among similar journals at scimagojr.com. The similar journal system in SCImago works by analyzing the bibliographic references shared between publications. Specifically, the platform calculates the percentage of references shared by journals and presents the results in descending order, showing first those journals with the highest degree of similarity based on this criterion.
SCImago Graphica retweeted

Del dato a la transformación. @scimago presenta su nueva marca que evoluciona hacia el conocimiento abierto y su poder transformador para la sociedad. #opendata #openscience #scimago linkedin.com/posts/gerardo-t…

SCImago Graphica retweeted
We at SCImago are entering a new stage with a renewed brand. It allows us to express what we do with more clarity and coherence, while staying true to our core: our commitment to #openknowledge and to turning trusted #data into impactful decisions acortar.link/5MeS5W #metrics

SCImago Graphica retweeted
The new edition of the SCImago Media Ranking has just been published (scimagomedia.com/rankings.ph…), the 2025 summer edition. The ranking includes more than 6,000 media outlets from 190 countries and over 130 languages, including newspapers, television stations, digital natives, magazines, and news agencies.