




$AMZN: The post-earnings gap is officially filled. Will AAPL and PLTR follow suit?
The confluence of the 20 and 50DMA is the area to watch now.

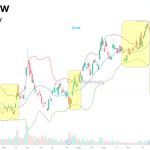
$NOW: The return to the Bollinger range ys playing out as mentioned yesterday.

$AAPL: Bounce after breaching the lower Bollinger band, an oversold condition quickly reached.
The price continues out of the bands' range, consolidation is more likely than continuation of the selloff.


$NOW: Price action is showing early signs of consolidation before a return to the Bollinger range.
While a full bounce to all-time highs is unlikely compared to previous setups, a bounce could retest 122.

$AVGO: Bullish divergence in play (lower price and higher RSI).
As long as 325 holds today as support, the bounce would gain traction.

$IREN: Approaching earnings with a bullish RSI divergence.
If technicals predicted earnings reactions, this would be a solid buy.
Bounce ahead?

$MU: No floor in sight for Micron. Price action showed strong bearish conviction, making 834 difficult to hold. If that level is breached, 786 is next.

$INTC The weekly chart says Intel has gone too far too fast, not to mention the daily chart.
If the price does not bounce right here, $54.1 is the next support zone where institutional algos may trigger buy orders.
A bounce to ATH is not expected, a consolidation is.


$AAPL: Revenue guidance did not satisfy The Street. The price is set to open below the daily Bollinger band in a quite oversold technical condition.
Previous visits to the lower band have preceded bounces. Let's see how this time plays out.

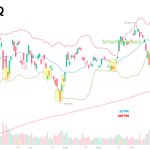
$PLTR: Topped Wall estimates, and U.S. commercial revenue more than doubled while surpassing U.S. government revenue.
The price may open tomorrow below the lower Bollinger band, suggesting major risk for bears from the fundamental and technical stand point.
Buy the gap down?

$MU: Indecisive weekly candle; not my favorite for bullish reversals.
Anyway, given the oversold conditions and the support at the 30 weekly average, a bounce must be considered.
912 makes the difference between tactical bounce and a solid bullish reversal.

$GOOG: extremely oversold relative to Bollinger bands and every oscillator.
P/E ratio at multi-decade lows. Not seen since 2012.
Be careful shorting this one here.

$MSFT: Price action is back in compression mode. Will this squeeze precede another bull leg? Bulls must reclaim 526 and hold it as support next week to maintain momentum.

$QCOM is reporting earnings this week. The price is oversold testing the lower edge of the volume shelf and there is a gap above at 179.
If technicals worked to predict earnings, the loss of the 200DMA could be read as a short-term event.

$IWM executed a textbook lower-to-upper Bollinger Band bounce.
Keeping bullish potential depends on bouncing from the 20DMA and the CWL stays as support next week.

