

SEBI RIA No INA000007881| MissioN SMILE | Stock SIP| Stock Advisory| Premium Offerings: https://teapawt.org/t.co/xhGNuQIbSV
Ahmedabad/ Bangalore/Mumbai
Joined May 2016
- Tweets27.3K
- Following709
- Followers48.3K
- Likes29.5K



Pinned Tweet
India’s next big power story isn’t solar
it’s NUCLEAR ⚛️
We’re entering a multi-decade capex cycle — and almost no one is talking about it yet.
🇮🇳 100 GW target by 2047 (vs ~8 GW today)
💰 ~₹19 lakh crore investment opportunity
⚡ AI + EVs = 24x7 baseload demand
Renewables are growing fast — but they’re intermittent.
Nuclear = low carbon + reliable + scalable
And now, the real inflection 👇
* SHANTI Act 2025 → private sector entry
* Liability reforms → supplier ecosystem unlock
* SMR push + ₹20,000 Cr allocation
* Execution pipeline finally building up
This is a high-entry-barrier sector
→ 7+ year approvals
→ Limited qualified vendors
→ Deep, durable moats
Which means:
The real winners may be a handful of suppliers most investors aren’t tracking.
From EPC to critical components —
this is a full ecosystem play.
We’ve decoded it all:
Value chain. Policy shift. Key beneficiaries. Risks.
👉 Full 38-page detailed report covering value chain, players & risks:
missionsmile.smartsyncservic…


Some lessons come from books. Some come from leaders who build institutions. Grateful to learn from Murugappa Group’s Mr. M. M. Murugappan, Executive Chairman & Mr. @muthu2107 , CEO- EID parry whose turnarounds at CG Power, Shanthi Gears & EID Parry inspire generations.
EID parry is 238 year old.


P N Gadgil Jewellers Delivers Strong Q2 FY27 — Revenue +22%, EBITDA +94%, PAT +53%
PN Gadgil Jewellers grew revenue and profits in Q2, with EBITDA rising much faster than sales. The H1 numbers were strong too. But the growth came alongside higher borrowings, rising finance costs and a sizeable cash outflow.
In Q2, consolidated revenue rose 22.4% year on year to ₹2,666 crore, up 10.5% from Q1. EBITDA increased 94% to ₹207 crore, and the EBITDA margin widened to 7.8% from 4.9%. PAT grew 53% to ₹121 crore, while EPS rose to ₹8.69 from ₹5.84.
For H1 FY27, revenue was up 30.5% to ₹5,079 crore, and PAT increased 52.3% to ₹226 crore.
The company also completed a ₹700 crore QIP at ₹609 per share. It plans to use about ₹239 crore for four new stores and ₹299 crore for working capital. The figures shared indicate that around ₹270 crore of the working-capital allocation has already been used.
There’s a cash-flow question behind the earnings growth. Operating cash flow was negative ₹363 crore in H1, compared with negative ₹106 crore a year ago. Inventory increased by about ₹778 crore during the period. Borrowings also rose to approximately ₹1,965 crore, from ₹1,580 crore in March, while finance costs more than doubled to ₹41.8 crore.
So, the quarter looks strong on sales and profitability. The next thing to watch is whether inventory and cash conversion improve as the company expands its store network—and whether that growth can support the higher financing costs.
SEBI Disclosure: This post is for educational and informational purposes only and should not be construed as investment advice or a recommendation to buy, sell or hold any security.
#PNGJewellers #Q2FY27 #Earnings #Retail #Jewellery #IndianMarkets
🤖 Made with AI

Aarti Pharmalabs Delivers Strong Q2 FY27 — Revenue +46%, EBITDA +110%, PAT +249%
Key Highlights:
◆ Strong Revenue Growth: Consolidated revenue surged 45.9% YoY to ₹610.5 Cr, compared with ₹418.3 Cr in Q2 FY26. Revenue also grew 13.9% QoQ, indicating healthy business momentum.
◆ EBITDA More Than Doubles: Calculated EBITDA jumped ~110% YoY to ₹135.2 Cr, while EBITDA margin expanded to 22.1% from 15.4% a year ago. However, margin contracted sharply from 25.4% in Q1 FY27, reflecting sequential profitability pressure.
◆ PAT Surges 249%: Consolidated net profit increased to ₹71.5 Cr from ₹20.5 Cr last year. However, PAT declined 6.1% QoQ from ₹76.1 Cr. The sharp YoY growth also benefits from a lower, restated base and a turnaround in JV profitability.
◆ EPS Jumps: Basic EPS increased to ₹7.88 from ₹2.26 in Q2 FY26, reflecting the substantial improvement in reported earnings.
◆ Strong H1 Performance: H1 FY27 revenue grew 42.5% YoY to ₹1,146.2 Cr, while PAT increased 121.8% to ₹147.6 Cr, demonstrating strong first-half growth.
◆ Capacity Expansion & Growth Pipeline: The company continues expanding its Xanthine derivatives and CDMO/CMO businesses. In its earlier Q1 commentary, management outlined a ₹149 Cr expansion plan for Atali Block 2, alongside expectations of 40–50% FY27 CDMO/CMO growth. Execution and utilisation remain important monitorables.
◆ Cash Flow Raises Concerns: Despite H1 PAT of ₹147.6 Cr, operating cash flow declined nearly 69% YoY to just ₹30 Cr. Inventories and receivables increased significantly, while total borrowings rose to approximately ₹836 Cr from ₹686 Cr in March 2026. Working-capital management remains a key concern.
◆ Exceptional Item & Contingent Liability: The company recognised a ₹2.04 Cr exceptional charge relating to a disputed stamp-duty matter. A further ₹57.46 Cr has been disclosed as a contingent liability, with the matter currently under legal challenge.
◆ CFO Transition: Piyush Lakhani resigned as CFO, effective 30 October 2026. Vibha Thakkar, previously associated with NOCIL and other established companies, will assume the role from 31 October 2026.
◆ Watch Point — Margin Sustainability: Despite strong YoY growth, EBITDA was broadly flat QoQ even as revenue increased nearly 14%. The key question is whether higher capacity utilisation and CDMO growth can restore margins while improving cash conversion.
Bottom Line:
Aarti Pharmalabs delivered strong Q2 FY27 revenue and earnings growth, supported by a substantial improvement over last year's profitability. However, sequential margin compression, rising borrowings and weak operating cash flows temper the headline performance.
The next few quarters will be crucial in assessing whether capacity expansion translates into sustainable margins, stronger cash generation and improved returns on capital.
Strong growth is encouraging, but converting that growth into consistent cash flows will be the real test.
SEBI Disclosure: This post is for educational and informational purposes only and should not be construed as investment advice or a recommendation to buy, sell or hold any security.
#AartiPharmalabs #Q2FY27 #Earnings #EquityResearch
🤖 Made with AI

GRP Limited’s Q2 and H1 FY27 results: good growth, and a few things to keep an eye on
GRP had a strong September quarter. Revenue grew, profits rose, and EBITDA margins improved—even as raw-material costs put pressure on gross margins.
Here’s the quarter at a glance:
> Revenue from operations was ₹172.3 crore, up 30% year on year.
> EBITDA came in at ₹18.2 crore, up 60%.
> EBITDA margin improved to 10.5%, from 8.6%.
> PAT rose to ₹6.4 crore, compared with ₹2.0 crore last year.
> Gross margin fell to 45.8%, from 51.1%, as input costs increased.
The H1 numbers were strong too: revenue grew 29% to ₹329.2 crore, EBITDA rose 60% to ₹35.6 crore, and PAT increased 185% to ₹10.6 crore.
What stands out is that EBITDA margins improved even while gross margins came under pressure. That suggests efficiencies and scale helped—but it’ll be worth watching whether GRP can keep that up if input costs remain high.
The company is also investing in growth beyond reclaim rubber, including adjacent tyre-recycling and plastics operations. It plans ₹90–100 crore of capex in FY27 and aims to increase reclaim-rubber capacity from around 88 KTA to 110 KTA, while expanding adjacent EOL tyre and plastics capacity from around 39 KTA to 130 KTA by FY30.
Those plans could open up new revenue streams, but the next step is execution: getting facilities commissioned, building utilization and turning the added capacity into profitable growth.
The numbers are encouraging. The things I’d watch next are margins, project ramp-up and cash generation as the business expands.
#GRPLimited #Q2FY27 #Earnings #Recycling #CircularEconomy #IndianMarkets

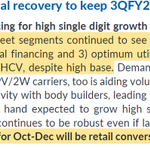
🧵 India’s Auto Industry: Festive Demand, EV Growth & the Rural Slowdown
India’s automobile sector is showing mixed signals this festive season.
Two-wheelers remain resilient, passenger vehicles face demand pressure, commercial vehicles are recovering, and tractors face monsoon-related risks.
Here are 7 key takeaways from the latest industry channel checks. 👇
Source: YES Securities, Automobile Channel Check, 26 October 2026
7/7 | The Big Picture: Recovery Is Uneven 🎯
India’s automobile sector is not experiencing a uniform demand recovery.
The current picture:
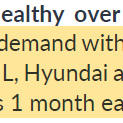
✅ Two-wheelers: Healthy festive momentum, led by urban demand.
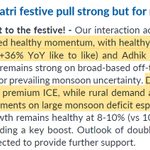
⚠️ Passenger vehicles: Weak Navratri sales; Diwali is critical for recovery.
📈 EVs and CNG: Increasing consumer traction.
🚚 Commercial vehicles: Supported by fleet replacement and infrastructure activity.
⚠️ Tractors: Vulnerable to monsoon uncertainty and farm-income pressure.
The most important variables to monitor are festive retail conversion, dealer inventory, rural demand and pricing discipline.
Final takeaway: The next phase of India's auto cycle will depend not just on festive demand, but on whether demand remains sustainable after the festive season.
Smart Sync Investment Advisory Services retweeted
Humanoid Robotics: The Next AI Opportunity - and the Biggest Execution Gap?
The next AI breakthrough may not be a chatbot. It could be a robot.
AI is moving beyond screens into the physical world. Yet factory-task accuracy remains around 60% vs the 98%+ required for industrial deployment, according to industry checks.
As AI models improve, robotics could unlock opportunities across software, training data and hardware.
But which companies will benefit, and what challenges remain? A deep dive into the emerging robotics opportunity.
11/11
The investment takeaway: Technology progress ≠ Investment returns
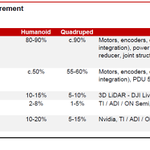
Humanoid robotics could create opportunities across AI models, data infrastructure, actuators, sensors, dexterous hands and manufacturing.
But valuations deserve attention.
Unitree's research valuation uses 25× FY27 estimated sales, compared with ~9× for Chinese robotics peers. Over 70% of its humanoid revenue is estimated to come from research buyers.
What investors should monitor:
Real-world reliability and operating uptime
→ Repeat commercial orders
→ Data quality and model improvement
→ Hardware costs and manufacturing yields
→ Margins, cash generation and valuation
Bottom line: Humanoid robotics could become a major long-term industrial opportunity. But sustainable returns will depend on commercial execution.
Intelligence → Reliability → Deployment → Unit Economics → Profitable Scale.
Source: Nomura Research Report