

A lifetime of searching for the truth, using an evidence based approach. https://teapawt.org/t.co/kfepq1a0Va
United States
Joined October 2026
- Tweets67
- Following42
- Followers7
- Likes75




Spot on!

EARTH'S DISASTER CYCLES PART 5
14,600 YEARS AGO, EARTH'S OCEANS BEGAN RISING AT AN EXTRAORDINARY RATE
There is a period in Earth's history that I think deserves far more public attention.
Around 14,600 years ago, during the last great ice-sheet retreat, sea level rose approximately 10 to 20 metres in an interval lasting no more than about 500 years.
Scientists call it Meltwater Pulse 1A.
We have physical evidence preserved in ancient shorelines, marine deposits, and coral records.
A 2025 study in Nature Geoscience examined where the water came from and how the loss of ice across different regions contributed to the rise.
Now consider what this would have meant for people living at the time.
During the last ice age, sea level had been roughly 120 metres lower than today.
Enormous areas that are now underwater were once dry land.
Coastal plains stretched far beyond modern shorelines. Rivers followed different courses. Landscapes existed that have since disappeared beneath the oceans.
As the ice sheets melted, those environments changed.
Not in one worldwide tsunami, but through sustained sea-level rise that could transform coastlines within generations.
In North America, huge ice-dammed lakes repeatedly burst, sending catastrophic floods across the Pacific Northwest.
Those floods happened again and again as the ice dams rebuilt and failed.
This is where my interest in ancient flood traditions meets the geological record.
We know enormous floods occurred. We know coastlines disappeared. We know human populations were living through these changes.
What we don't yet know is how much of that experience survived through oral history.
I believe that question deserves a serious investigation grounded in archaeology, geology, and the actual dates.

1
7
Two infants shared a burial pot in Nasca-period Peru. One had one central eye socket!
truthinstone.com/sites/nazca…
Cyclopia is extremely rare; find out more!
Study: Tomasto-Cagigao et al. 2026

1
Is the Sun shrinking?
A 1567 eclipse study says not steadily.
solarevidence.com/guides/sol…
If Rome saw totality, the Sun's radius was at most 696,200 km. The authors say that rules out steady shrinking. Slow changes over centuries remain possible.
Image: Galileo, public domain

1
2,190
I’m a firm believer that human history is far older, and a lot stranger than we realize. I also believe the evidence is clear we’ve been thru a series of major cataclysms during that time. Posts like Jason’s below go a long way in helping us find, and understand the truth about our past.
EARTH'S DISASTER CYCLES PART 4
THE LAST 150,000 YEARS WERE FAR MORE VIOLENT THAN MOST PEOPLE REALIZE
We tend to imagine the last ice age as a long, frozen period where very little changed.
That's not what the geological record shows.
The planet repeatedly shifted between colder and warmer conditions, sometimes with remarkable speed.
During the last glacial period, Greenland experienced around 25 abrupt warming events known as Dansgaard Oeschger events.
In some cases, temperatures in Greenland rose by several degrees, sometimes approaching 10°C, over just decades.
Then came longer periods of cooling.
Meanwhile, massive ice sheets covering parts of North America repeatedly released enormous numbers of icebergs into the Atlantic.
These are known as Heinrich events.
The icebergs carried rocks and sediment into the ocean, leaving physical evidence that scientists can still identify today.
Some of these events appear to have affected ocean circulation and climate across large parts of the Northern Hemisphere.
Then, around 14,700 years ago, the North Atlantic region warmed rapidly.
Around 12,900 years ago, it abruptly became colder again during the Younger Dryas.And around 11,700 years ago, temperatures rose sharply as the current warm period began.
Think about that sequence.
Warming. Cooling. Massive ice discharges. Shifting oceans. Then another sudden warming.
I find it difficult to look at this record and describe Earth's climate as naturally steady.
But I also think we need to understand something.
These events happened under glacial conditions very different from those we experience today.
The question isn't whether the exact same sequence is about to repeat.
It's what caused these enormous changes, why some happened so quickly, and whether similar physical processes could operate again.

1
18
915
Did Karnak's island echo a creation tale?
truthinstone.com/sites/karna…
Karnak sat on a Nile river-terrace island. Authors suggest the island layout may recall Egypt’s primeval-mound creation story. People could stay for good after 2520 BC ±420 years.
Photo: Marc Ryckaert, CC BY-SA 4.0

How did herding reach the green Sahara?
truthinstone.com/sites/takar…
DNA from two women at Takarkori, Libya, shows an isolated North African lineage. The authors suggest herding spread by cultural contact…..
Photo: Van Neer et al. 2020, CC BY 4.0

The canals at Aguada Fénix, Mexico, appear unfinished. Why?
truthinstone.com/sites/aguad…
Axes run up to 9 km, built 1050–700 BCE. A cross-shaped cache holds what the authors call the earliest known color symbols for directions in Mesoamerica.
Photo: Takeshi Inomata, CC BY 4.0

6,002
How many people lived in the ancient southwest Amazon?
truthinstone.com/claims/amaz…
Laser scans from planes mapped earthworks under the forest. The authors propose about 1.25–3 million people around 100-300 A.D.
Image: Pärssinen et al. 2026, CC BY 4.0

1
6,131
Was the Nebra Sky Disc buried with the swords used to date it?
truthinstone.com/sites/nebra…
UNESCO says it features "the oldest concrete depiction of cosmic phenomena worldwide." Most work dates it to the Early Bronze Age. Two critics say it is younger.
Photo: Shonagon, CC0

14
NOAA puts X-class flare odds at 20% each UTC day, Nov 8–10.
services.swpc.noaa.gov/text/…
Sunspot region 4566 keeps developing. This is a whole-Sun forecast, not the odds of a mass ejection aimed at Earth.
Illustration: NASA/SDO, public domain

72
NOAA logged M1.2, M1.4 and M1.9 flares on Nov 7.
solarevidence.com/live-dashb…
Peaks (EST): 7:43 AM, 12:17 PM and 1:42 PM. All fall in the R1 (Minor) range, not proof of ground radio impacts.
Image: NASA/SDO, public domain; illustrative

9
A NOAA alert says a G1 (Minor) geomagnetic storm level was reached at 2:45 PM EST today.
solarevidence.com/aurora-ton…
NOAA's 7:30 AM forecast shows Kp 4.00 for 7–10 PM EST. Look north under clear, dark skies; sightings are not guaranteed.
Image: USFWS, public domain

6
SolarSteph is on it!

Today's aurora and space weather 3-day forecast! 🌌 The Sun fired another M-class flare (M1.3) around 13:00 UTC ☀️💥 Coronal hole fast wind brings chance of G1 storms through Mon 🌬️ Aurora: chance in far N. Scotland Sat–Mon nights💚👀 forecast.stephyardley.com #spaceweather #aurora
1
14
An M1.2 flare peaked Nov 7 at 7:43 AM EST. It falls in NOAA's R1 (Minor) range, not proof of ground radio disruption.
Image: NASA/SDO, public domain; illustrative, not the flare peak
solarevidence.com/live-dashb…

13
AR 4566's M3.5 peaked at 1:33 PM ET Nov 5. NOAA listed it as beta-gamma-delta. Type II radio sweep ~609 km/s (shock speed, not CME speed).
SWPC: no Earth-directed CME detected in available imagery. @slyardley teapawt.org/slyardley/status/21184…
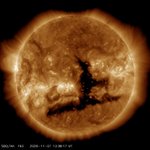
The Sun over the last 24 hours! 🌞 While we can see the huge coronal hole (dark hole) rotating around the Sun produced an M class flare from complex active region 4566 (left of the coronal hole). 🌞 💥 Definitely a region to watch over the next couple of days! 👀
1
17
Machu Picchu was in use from about AD 1420 to 1532. The dates come from burials near the site.
Ancient DNA shows retainers with ancestry across the Inca Empire, including Amazonia.
How did they come to be there?
truthinstone.com/sites/machu…
Photo: Jorge Castro Ruso, CC BY-SA 2.0

14
At Pueblo Bonito in Chaco Canyon, nine people share one mother-line DNA. They lie in an elite burial room.
Their burials span about 330 years, from about 800 to 1130 CE.
truthinstone.com/sites/chaco…
Photo: HJPD, CC BY 3.0

12
NOAA has a G1 (Minor) storm watch for Nov 6–7. Northern lights may show Friday night.
The strongest 3-hour forecast is about 7–10 PM ET. If skies are clear, look north from places like northern Michigan or Maine.
Image: USFWS, public domain
solarevidence.com/aurora-ton…

7
Why do the small Nazca figures in Peru sit near foot trails, while the giant ones sit near the long desert lines?
A 2024 AI survey found 303 new figures and mapped where each kind sits.
truthinstone.com/sites/nazca…
Photo: Unukorno, CC BY 3.0

7