

| Trader | Live and judge righteously |
Joined December 2023
- Tweets122
- Following184
- Followers99
- Likes12.6K


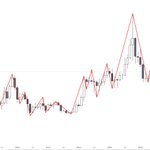


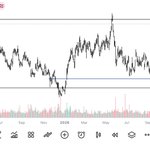


$BNB step by step analysis
1. Structure
Identify the highs and lows that stick out like a sore thumb. Condense your chart to see the major highs and lows better. Use the 'path' tool on Tradingview to map out those highs and lows to visually see them better

1
1
67
2. Identify the trend
Uptrend = Higher highs and higher lows
Downtrend = Lower lows and lower highs
As you can see, BNB on the monthly is in an uptrend until the $499 low is lost. Why that low? That $499 low is the low that led to the ATH, and has yet to be broken. Until the $499 low is lost, everything is a higher low.
This is the monthly, of course it depends on the time frame you're looking at. The market can be in an uptrend on the Monthly, but in a downtrend on the weekly. Always start on the monthly or higher, then work your way down. Yearly > 6M > 3M > monthly > weekly > daily > 4H > 1H > 15m > 3m. Those are the main time frames I use to find trades.

1
34
$BTC long stopped -1R

1
57


$BTC LONG
————————-
Entries: 66130
Stop loss: 65570
Take profits: 72250 (will change depending on the structure formed before long is filled)
Comments
- last stand for bulls
- fib golden pocket, VAL
Very confident in this one!

1
1
74


