

Coffee in the morning, long walks, and a quiet mind. Just trying to enjoy life as it is.
Joined December 2014
- Tweets683
- Following91
- Followers268
- Likes9.9K




🚨It has now been officially confirmed that🚨
Bitcoin is currently in its longest bear market in history.
Every previous bear market has ended within 13 months of reaching its peak:
• 2014 -85%, lasting 406 days
• 2018 -83%, lasting 364 days
• 2022 -77%, lasting 378 days
Now, it's been 411 days…
Bitcoin's cycle has never broken in a decade.
1,064 days up. 365 days down.
Same cycle, every time.
$BTC
2
71
1,372
This selloff is obviously manipulated.
Big whales are liquidating leverage traders to get your coins for cheap.
The bull run will only begin once everyone has been wiped out.
Hey @grok , please be brutally honest
Will Bitcoin crash to a new low of $38.5K after 6 consecutive weeks of decline?
Start with a YES or NO
$BTC Bull trap confirmed.
One final shakeout around $59K–$60K.
That's where the last weak hands get flushed out.
Then straight to $100K. 🚀
13
52
5,011

THIS IS INSANE
Look at the liquidity below $BTC.
There's almost nothing there.
You aren't ready for what's coming.
When $BTC fell below its long-term support line, the crowd clamored, “It’s over.”
Then, the bottom finally hits and the big move begins.
1
64
821
The simplest $BTC strategy in existence
Buy 500 days BEFORE the halving
Sell 500 days AFTER the halving
Repeat
1
63
664
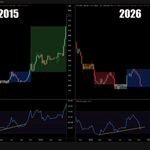
🚨 BITCOIN IS FOLLOWING THE SAME 4-YEAR PATTERN FOR THE FOURTH TIME!!
And if this structure holds, 2027 could become one of the best accumulation windows of this decade.
Look closely at the chart.
2014 → Bear market
2015 → Fake-bull / recovery
2016 → Bull #1
2017 → Bull #2
2018 → Bear market
2019 → Fake-bull / recovery
2020 → Bull #1
2021 → Bull #2
2022 → Bear market
2023 → Fake-bull / recovery
2024 → Bull #1
2025 → Bull #2 / cycle top
Now look at the possible next sequence:
2026 → Bear market
2027 → Fake-bull / recovery?
2028 → Bull #1?
2029 → Bull #2 / new cycle top?
Three full cycles have already followed this structure.
And a fourth one may be unfolding right now.
But here’s what makes this cycle especially interesting.
First, the drawdown was much smaller.
Previous Bitcoin bear markets erased roughly 77% to 85%.
This time, BTC fell from $126,000 to $58,600 — around 53%.
Second, the correction happened much faster.
Previous cycle bottoms took around 363 to 406 days to form.
This time, Bitcoin hit $58,600 just 268 days after the top.
So now the big question is simple:
Was $58,600 already the cycle bottom?
Or do we still get one final capitulation before the real recovery begins?
If this historical pattern continues, 2027 could be the year smart money accumulates while most people still think Bitcoin is dead.
And if the cycle stays on track:
2027 → recovery
2028 → bullish expansion
2029 → potential new cycle top
Keep in mind:
History does NOT guarantee the same result.
But ignoring a pattern this consistent could be a very expensive mistake.
Save this chart.
Come back to it in 2027.
$60K $BTC is where conviction getting tested
If this zone holds again, i am 100% sure
all those people calling for $40K might have to delete a few tweets
everybody wants to buy the bottom, but nobody wants to buy when price actually reaches a major support zone
then they wait for $90K to confirm the reversal and start chasing again
Poor fellas, see you on the other side