
The Foundation for Stroke Prevention. Steven Rudolph, MD, Director
- Tweets1.1K
- Following110
- Followers3.9K
- Likes1


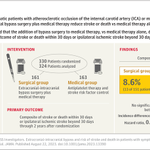

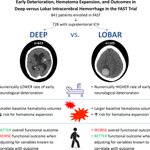


ALT Graphic abstract in Zhang et al.


ALT A green background features the words "Drug Safety Communication" in bold white and dark blue text. Below are outlined images of medical items, including bottles, a nasal spray, a syringe, tablets, and a blister pack. The FDA logo is in the top right corner.




ALT A line graph compares the cumulative hazard of a primary-outcome event over five years between standard and intensive treatments. The intensive treatment line is in blue, and the standard treatment line is in gray. An inset chart displays the hazard ratio as 0.79 with a 95% confidence interval of 0.67 to 0.94, and a p-value of 0.007. Below the graph, a table shows the number at risk for each treatment over time.

ALT This image is a forest plot compares intensive treatment versus standard treatment across various subgroups. The chart shows hazard ratios for primary outcomes, with confidence intervals. Subgroups include age, race, diabetes, chronic kidney disease, blood pressure levels, body-mass index, prior cardiovascular disease, and qualifying event. The hazard ratios and confidence intervals are displayed along a horizontal axis, indicating whether intensive or standard treatment is better.

ALT A graph from the Original Article " Pelacarsen and Cardiovascular Outcomes in Patients with High Lipoprotein(a).” The trial name, Lp(a)HORIZON, is in parentheses after the title. The graph shows four-component MACE in full population with lipoprotein(a) level 70 mg/dl. The trial results are being presented at the American Heart Association Scientific Sessions 2026. The logo of the New England Journal of Medicine is at the bottom.


ALT The image is a slide from the American Heart Association about reducing spironolactone-based blood pressure management after a stroke. It outlines the objective, study design, and conclusions. The slide has the American Heart Association logo and contact information at the bottom.


ALT A graph from the Original Article "Discontinuing Statins in Older Adults without Cardiovascular Disease." The trial name, STREAM, is in parentheses after the title. The graph shows estimated cumulative incidence of primary-outcome events. The trial results are being presented at the American Heart Association Scientific Sessions 2026. The logo of the New England Journal of Medicine is at the bottom.

ALT A graph from the Original Article "Intensive Blood-Pressure Control in Patients with Previous Ischemic Stroke.” The trial name, OPTIMAL-STROKE, is in parentheses after the title. The graph shows the cumulative hazard of the primary outcome. The trial results are being presented at the American Heart Association Scientific Sessions 2026. The logo of the New England Journal of Medicine is at the bottom.


ALT Graphic abstract in Shimizu et al.

ALT An illustration from the Review Article "Intravenous Thrombolysis for Acute Ischemic Stroke — New Directions" that shows cerebral circulation. Two main sections show different views and detailed insets. Some labeled areas include the internal carotid artery (ICA), the first segment of the middle cerebral artery (M1), the M2 and M3 branches of the middle cerebral artery, and the proximal anterior cerebral artery (A1) and its first branch (A2).


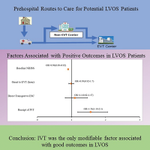
ALT Graphic abstract in Lin and Cramer.