

Technical analysis should be made as simple as possible, but no simpler. --Albert Einstein, probably *not financial advice* 👇👇 free open-source indicators
Joined September 2015
- Tweets17.8K
- Following1.2K
- Followers31.5K
- Likes33.1K





$BTC daily
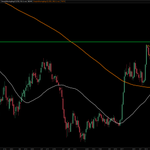
The 365 SMA (blue) and EMA (yellow) are reliable long-term indications of a bullish or bearish regime.
The bullish break above these MAs in September was explosive, and it spent the next month consolidating inside the range of just one of these candles.
This kind of volatility contraction can lead to spectacular and sustained expansion, but when it slipped below the range this weekend, all we saw was a measured pullback into support.
Bollinger Bands are also not confirming a breakdown. The bands continue to contract, and so far there is not a single close below the bands. But we have a lot of wicks below and closes above, suggesting a potential liquidity sweep and seller exhaustion.
Given that we are in a fresh bullish regime, above possibly the most significant moving average ribbon that exists on the daily chart, I can't be too concerned about this 9.5% pullback after a 50%+ rally off the lows.
I'm gonna let it cook some more and see what shapes up into this FOMC Wednesday and midterms. While bulls are vulnerable in the short-term, we remain in full control in the big picture.

$BTC weekly
That was a weak sauce weekly close bros.
Losing the 10 SMA reduces the odds of a quick bounce to new highs, and improves the odds of a deeper retrace into the mid 70's.
However, it is worth noting that both the ETFs and CME futures closed the week above the 10 SMA (not shown).
Bulls also have potential support from the 50 and 100 EMAs, as well as the trendline connecting the May and August highs.
That said, I give SMAs and horizontals more weight than EMAs and diagonals, and I also give spot BTC more weight than the ETFs or futures. So as much as I love to bull post, I've gotta respect the potential for a choppier November than I hoped for.
We'll be looking for follow through one way or the other into the monthly close to help us set expectations for November.


$BTC CME futures weekly
Closed above the 10 SMA with the first hollow red candle since April 2025, and it is also an inverted hammer.
Spot often follows suit, so this increases the odds that spot will hold the 10 SMA through the weekly close.


$BTC weekly
This has the potential for a shockingly bullish reversal.
Looking for a close above the 10 SMA.

$BTC closes day 31 inside the body of the September 21st candle.
Once again, we are near the bottom of the range, with support intact.
Sticking to my guns. This is near maximum R/R for longs. Not where you want to flip bearish.

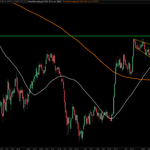
$BTC has now closed 28 days inside the body of one daily candle.
This is extremely rare. It has only happened 5 times in bitcoin's entire history.
Look closely and you will see that it has never had a false breakout from one of these ranges. In other words, it has always continued in the direction of the initial break.
If this pattern continues, then right here near the bottom of the range is about the best R/R you are going to get, and the ensuing move is likely to be massive.


Bitcoin has a history of testing the 50 SMA about 100 days after it bottoms, then going on a monster run.
Keep an open mind to better-than-expected outcomes.


$BTC daily
It's all coming together.
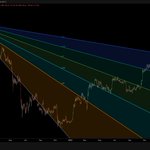
Retest of the Q2 high + fib fan + 50 SMA, the confined range, and the historic pattern of pumping ~100 days after the bottom, all pointing higher.
Today's prices still discount FOMC and election uncertainty, and that won't last much longer.

$BTC daily
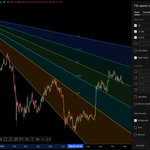
The 0.5 fib fan is providing strong support in confluence with the 50 SMA.
I'm not entertaining lower targets with support intact.
This favors continuation to the 0.618 level around 90K.

The new and improved Confined Range Candle Finder is online.
Enhancements include multi-timeframe support, filtering based on the direction of the containing candle, improved display settings, and more.
Free and open source for the bros 👊
tradingview.com/script/Kh2lS…
