

Systematic Trading, Research & Automation | 25+ Years in the Markets | Founder of https://teapawt.org/t.co/OQxgym3J00
Joined August 2022
- Tweets1.6K
- Following94
- Followers10.7K
- Likes27





Pinned Tweet
I’ve been trading for ~30 years.
First half: fully discretionary, living inside futures microstructure. It worked—until algos started exploiting the same patterns and reacting in microseconds. Edge decay was real.
So ~10 years ago I switched to systematic.
Now I run many uncorrelated strategies in parallel without babysitting screens all day. I wouldn’t go back.
My biggest unlock: reusability of know‐how.
When I finish a new system, I plug it into a ready workflow in minutes. It monitors itself; I move my brain to the next big thing.
Here’s the playbook I wish I had from day one:
- Framework (design once → reuse forever)
- Data → clean, feature, label.
- Hypothesis → simple, testable edges (breakouts, momentum, mean reversion).
- Validation → IS/OOS, realistic costs/slippage.
- Risk → position sizing, max heat, portfolio exposure caps.
- Deploy → automated orders, fail‐safes.
- Monitor → health dashboards, kill‐switch rules, mobile app.
- Iterate → new systems slot into the same pipeline.
Principles that compound:
- Many small, independent edges > one “genius” setup.
- Process beats prediction.
- Shipping beats perfecting.
Discretionary taught me markets. Systems gave me scale.
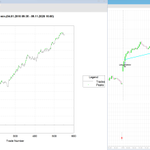
Update on my long-only Donchian breakout model for active stocks, mostly tech.
I built it to complement my rotational momentum strategies because it moves to risk-off much faster.
The logic is simple:
- Enter long on a breakout above recent highs.
- Trail the position with a stop.
It is currently in drawdown, but nothing dramatic so far.
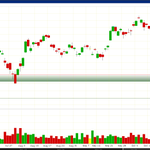
Current longs: $SPCX, $AAPL, $TSLA.

I don’t have a single “best” strategy.
They all have good and bad periods. What I find useful is running them together in a portfolio.
A recent example: Fast long mean reversion on daily bars has struggled lately. Meanwhile, the slower weekly long mean reversion model I track on S&P 500 stocks recently made new equity highs.
That makes a daily/weekly combination worth testing. Even within the same strategy family, different timeframes can help diversify a portfolio.
The weekly model’s principles are simple:
- Use RSI on weekly charts.
- Favor lower market volatility.
- Trade in the direction of the main trend.
I track the model’s performance and statistics here:
crackingmarkets.com/buy-the-…

Do you use a dead man's switch in your automated trading?
The automation can stop while positions remain open. And I may be unable to access the server to fix it.
One safeguard I find useful, especially for short stock positions: GAT (Good After Time) closing orders submitted directly to Interactive Brokers.
These are scheduled to become active at a future time - for example, two trading days later.
While my automation is running, it can cancel or modify them. If it stops, the closing orders are already held at IBKR and become active at the scheduled time without another instruction from my server or me.
The previous maximum drawdown in this Nasdaq 100 long mean reversion backtest was about 20%. This November, it reached about 40%.
Stressful periods like this are often the best learning opportunities.
This is the model I share with a free backtester on Cracking Markets, under Interactive Models → Buying Short-Term Dips in Stocks (I dont trade this live).
The current selloff in AI-related Nasdaq stocks has pushed it into a deep drawdown. What are the lessons?
Mean reversion takes positions against a move. Sometimes that move keeps going, and it hurts. I have to plan for future drawdowns worse than anything in the backtest.
What I do in my own portfolio:
- I trade mean reversion across broader stock universes to reduce concentration. That helps, but only so much.
- I limit the combined allocation to ALL my long mean reversion strategies. Several systems buying the same selloff can suffer together.
For example, a 20% portfolio allocation suffering a 30% drawdown would mean roughly a 6% portfolio loss, before gains or losses elsewhere. That is already a serious hit. My own allocation is more conservative.
We have to accept risk to earn returns. Being smart does not remove it, and the backtest may not reveal its full extent. That is why I don’t treat the worst historical drawdown as the basis for how much risk I can afford.
In this model, the historical maximum was about 20% - until it became about 40%.

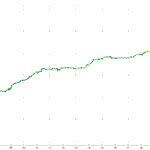
A quieter year so far for my intraday breakouts, but the equity curve is holding up quite nicely.
This is a QQQ backtest of my intraday volatility breakout, using the exact settings I share on my blog. The last few years are out of sample.
The idea is simple:
- Breakout entries at today’s open ± ATR.
- A small stop, otherwise exit at the end of the day.
- A filter to trade only days with higher potential for a larger move.

Great to see everyone at our annual Prague meetup on Saturday. 90 fellow Czech systematic traders in one room.
The biggest progress I noticed: how much faster people are developing portfolios of different strategies, using AI as a technical assistant. For traders who don’t program, the technical barrier is finally coming down.
It also got me thinking about a meetup in Málaga, Spain.
I’d be happy to organise something for a smaller group if there’s enough interest. If you’d be interested in joining, let me know.

6
27
2,296
I’m glad I scale into my Nasdaq long mean reversion trades in several legs.
This is a type of the MRZ scale-in strategy I shared here earlier. I still have room to add at lower prices and bring down my average entry price.
But yesterday’s dip was a big one.

6
14
1,956
I stopped trading this intraday long/short mean reversion strategy a few years ago. The average profit per trade had become too small for me.
But I keep coming back to it. The backtest still suggests there is an edge.
The logic is simple:
• Screen Russell 3000 stocks for large, volatile moves.
• Use limit orders the next day to trade a reversal.
• Take up to 10 long and 10 short positions.
• Exit if a wide intraday stop is hit, or at the end of the day.
Fees are included in the backtest. No overnight positions.

One thing I really appreciate about coding with LLMs: they don’t get fed up with me.
Trading research involves a lot of pivots. You put a huge amount of work into preparing data and running initial tests. Usually the results show that the idea leads nowhere. So you start again. I can understand why a programmer would eventually get tired of that.
I’m currently testing systematic options strategies. I hit a wall and needed to move the app to a new server with more storage; finish a tool for manual analysis; redo calculations we’d spent the last few days working on.
At that point, a human programmer might have told me to fuck off. The LLM had everything prepared overnight, including an independent audit. What a relief.

8
25
2,442
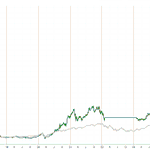
I still find it crazy how much a monthly rotation into the top 5 Nasdaq 100 stocks by momentum has outperformed the index over the past 10 years.
Green: momentum rotation.
Gray: Nasdaq 100.
But the volatility is wild too.
That’s why, in my own trading, I try to get the best of both worlds:
• I trade momentum rotation instead of simply holding the Nasdaq 100.
• I scale the exposure using volatility targeting, aiming for around 20% annualized volatility.
So far, I’m getting similar performance to the Nasdaq 100 with much less capital allocated.

I’m getting ready for the annual in-person “traders’ chat” I run with Czech traders, where I share what I do and how they can do the same.
Part of the preparation is refreshing the stats from last year’s presentation. The portfolio loosely follows what I trade in my own account.
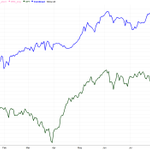
The equity curve combines 2 rotational strategies, 4 long mean reversion strategies and 1 intraday breakout strategy.
Blue: out-of-sample performance since last year’s meeting.
Dark line: buy-and-hold SPY.
What a nice year.
Return +24.5%, max drawdown -4.73%, Sharpe 2.33.
And average overnight capital use of only 27%, with a maximum of 65%.
There really don’t have to be that many components to run a stable systematic portfolio.

7
23
2,313
Monday starts a new trading month. For many monthly momentum strategies, that means rotation.
These strategies form the backbone of my portfolio. Here is a simple Nasdaq-100 version you can start testing now and following from Monday.
The backtest, January 2000 - October 29, 2026:
• Annualized return: 18.85%
• Maximum drawdown: 46.98%
Green: the strategy.
Grey: the Nasdaq-100.
The rules:


The backtest uses Norgate data with current and past constituents and historical index membership. Commissions are $0.005/share, with a $1 minimum per transaction. Slippage is not modeled.
There is big room for improvement. A nearly 47% historical drawdown gives you something important to work on alongside the return.
But this gives you a concrete starting point: reproduce the backtest, get a first version running on paper, and follow the signals from Monday.
Observe the rotations, execution and drawdowns. Then test improvements against that baseline.
2
10
899
A smaller trading account can have advantages too.
One is the flexibility to use intraday limit orders for entries and exits.
The chart compares the same stock long mean reversion trades:
Blue: intraday limit execution.
Orange: execution at the close.
Same signals and share sizes, but different results.
Two rules I use to make my limit order backtests more representative of live execution:
I reserve capital for every working entry order, so the strategy can take all the trades if every order fills.
I also require price to trade through the limit. Simply touching it is not enough to count a fill.

For many traders who struggle to make money, the missing piece is discipline.
You need a process you can repeat over and over. And you need to accept that following it won’t produce a profit every day.
Even successful trading is a series of ups and downs, with a positive drift over time.
This is my long/short intraday breakout strategy, buying calls and puts. It loses more often than it wins, but the overall results have been good.
My responsibility is to make sure the strategy trades every day - and accept the ups and downs that come with the process.

A website is increasingly becoming an interface for LLM agents.
That could have interesting consequences for SaaS pricing.
In financial SaaS, I often see a large premium for API access to data already available through the web app.
Historically, using the cheaper interface meant doing the clicking and collecting yourself.
Now an LLM agent can handle much of that work. For most tasks, getting started can be as simple as writing a prompt in Claude Desktop.
APIs still have clear advantages in speed and reliability. But for a small research workflow and trading, though, those advantages may not justify a much more expensive subscription.
The futures trend-following project I shared a few months ago is now at a new all-time high in paper trading.
A useful reminder if you’re interested in learning how CTA-style futures portfolios work.
Lucas Joly has published his master’s thesis research on GitHub, using a Carver-style framework, alongside an ongoing paper-trading dashboard.
Research + code:
github.com/Lucas-Joly-GH/tre…

You don’t need a course or paid mentor to start learning systematic trading.
An LLM can be a very useful tutor. But you still have to do the work.
I get a lot of questions about how to get started. My suggestion: choose one published strategy with clear rules and results.
Then use an LLM to work through questions like:
• What principle is this strategy based on?
• Why might it have an edge?
• What data do I need?
• What is the simplest version I could test?
Get the data and ask it to help build first prototype.
A second LLM can help audit the code and results. You still need to verify the logic and inspect individual trades yourself.
From there, keep asking about everything you don’t understand.
Have it walk through the calculations. Ask it to build a manual with worked examples of entries, exits and position sizing.
If something is difficult to understand, ask for an interactive dashboard where you can change the inputs and see what happens.
That is a practical way to learn: connect the principle, the code and the behaviour of the strategy.
“Help me understand and test this strategy” is a much more useful starting point than “build me a profitable system.”
I wouldn’t expect an easy process. But access to explanations, examples and technical help at each step is extremely valuable.
The LLM can help you understand and assemble the building blocks. You remain responsible for the system you eventually build and trade.
2
30
3,034