

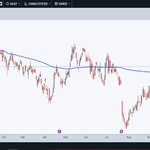




$NDX Crosses 20 SMA + TTM squeeze on weekly's. Some thing similar that happened in April'26

$TSLA breaking out of an ascending triangle! 📈
A retest near $387 could confirm the breakout and set the stage for upside. Target: $477 🎯
Bullish momentum building. Watching for confirmation! 🚀 xitter.cf/TKumar92123/status/211…


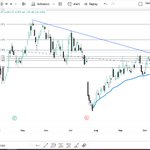
$TSLA — what a chart. 👀
Head & shoulders downside target met. Price has respected descending trendline & is tracking along July lows anchored VWAP
Gap fill, earnings & a trendline breakout are key levels to watch
TSLA will be an interesting chart to follow into December. 📉📈


$COST is up ~7.5% YTD (trading around $923.52), finding support after a pullback from its $1,096.50 high.
Historical Q4 (Oct–Dec) returns show volatile holiday swings:
2025: -6% | 2024: +4% | 2023: +16% | 2022: -4% | 2021: +27%


$TSLA — what a chart. 👀
Head & shoulders downside target met. Price has respected descending trendline & is tracking along July lows anchored VWAP
Gap fill, earnings & a trendline breakout are key levels to watch
TSLA will be an interesting chart to follow into December. 📉📈


$IBM On October 14, I highlighted improving momentum 📈
Price followed through, and now IBM is setting up for a potential gap fill.
Momentum gave the signal. Price action confirmed it. Now, all eyes are on that gap. 👀

$TSLA With global energy supplies under pressure and gas prices potentially staying higher for longer, the shift toward EVs could gain fresh momentum. Is energy security the next catalyst for Tesla? 🚗📈


$RDDT 📈
Crossed above the 20-day SMA, TTM Squeeze setup & Bouncing off an ascending trendline
👀 Watching for a breakout above the 200-day SMA to confirm further upside momentum.


