

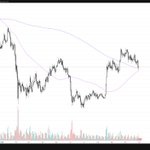





Alright, time for a sentiment check. What does this chart of Microsoft look like to you?
To me this looks like Distribution. Major Distribution...


Gold must hold this level or perform a short swing failure pivot and reverse up quickly.
I do not like that it is now below the 365 day Moving Average.

Bitcoin's Structure remains very Bullish
Can it break down from here? Yes of course it can. However, despite recent stock market weakness and volatility it has held up exceptionally well. That in itself is a tick in the Bullish camp
Patience is required here.


A major Divergence is coming for Bitcoin and XLE on the Ratio chart.
Does this descending triangle continue? Or is the bottom in for XLE?
There is no answer YET


XLE looks to be the next big mover. Gonna need a bigger position I think
Here it is VS XLU (utilities), UUP (DXY), and XLV (Healthcare)


If this is truly the next Bitcoin Bullrun...
$160,000 is the MINIMUM target to accept
(40x the price of an ounce of Gold. *moving target*)

What to do about Gold at a time like this when bond yields continue to go up daily?
Well, Gold is at an important must hold spot.
If the bull market is to continue this will be the bottom zone. It cannot lose $4000

Bitcoin is still looking very good here as long as it can get back into this range
Will be an important day to see if it holds

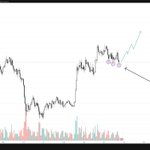
This Bitcoin Chart in isolation looks very solid. This is still a great entry spot
No matter what is happening in Bonds or the DXY you have to respect this chart
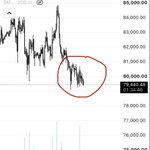
I'm bullish as long as it holds the 79K area

The DXY breaking out is not something you want to see if you are bullish Bitcoin or Gold.
Going up b/c yields are going up.

