


One hour of all active satellites in orbit as of October last year (sped up by 240x) by @Kipkoech_the4th - 😮
1

Color harmony is the process of choosing colors on a color wheel that work well together in the composition of an image.
Check this article by @tmrhyne
ow.ly/CSOk50DeKNn

"Understanding data visualization technologies is critical to recognizing and responding to enrollment trends and patterns — particularly for community colleges facing precipitous decline."
campustechnology.com/article…


🤔How To Avoid Data Vomit - A checklist to consider before telling any story with data
ow.ly/qWV250D5uqp
#dataanalytics #datavisualization #datascience #bigdata #BI #dashboard #dataviz

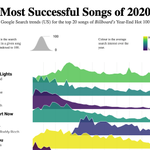
#Datavisualization of Most Successful Songs 2020
public.tableau.com/en-us/gal…
#dataanalytics #datavisualization #datascience #bigdata #BI #dashboard #dataviz


💡Friday Tip: Make Your Data Insights Visually Consumable
sloanreview.mit.edu/article/…
#dataanalytics #datavisualization #datascience #bigdata #BI #dashboard #dataviz

🌎 Earth Temperature Spiral - created by oscar6echo
🌡️observablehq.com/@oscar6echo…
repost from #observablehq
#DataVisualization #dataviz
Raving trouble to choose an Visualization?
check this infographic made by @PinakiLaskar
#DataVisualization
#ArtificialIntelligence #DataScientist #CloudComputing #BigData #Analytics #DataScience #MachineLearning

✨Sparkles "Star Map" by @mbostock on @observablehq
observablehq.com/@mbostock/s…
#dataviz #DataVisualization
If everyone uses the same rules, do we risk a joyless world of homogeneous visualisations?
📊medium.com/nightingale/rules…
repost from @DataVizSociety
#datavisualization buff.ly/38JVDTd