

"Perseverance is not a long race; it is many short races one after the other" - W.E.
Joined August 2023
- Tweets5.5K
- Following47
- Followers3.2K
- Likes19.2K






Pinned Tweet
🚨 EDUCATIONAL POSTS
I’m going to compile all my educational posts under this pinned post and will continue adding new ones (or series of them) as and when I publish them.
⬜️Wick Fill Strategy: teapawt.org/Trader_Vantage/status/…
⬜️VRVP & FRVP: teapawt.org/Trader_Vantage/status/…
⬜️OBs/BBs (Do they really work?) teapawt.org/Trader_Vantage/status/…
◽️BTC 4 Year Cycle Theory teapawt.org/Trader_Vantage/status/…
⬜️BTC 4 Year Cycle Theory (Version 2): teapawt.org/Trader_Vantage/status/…
⬜️✔️The Power of Simplicity: Why Your Chart Needs Less, Not More:
teapawt.org/Trader_Vantage/status/…
⬜️A little educational post on trading psychology:
teapawt.org/Trader_Vantage/status/…
⬜️A quick Educational Post on TFs:
teapawt.org/Trader_Vantage/status/…

🚨EDUCATIONAL POST:
🔨 VRVP & FRVP
VRVP and FRVP are, imho, some of the most underrated advanced charting tools out there. Not many traders I come across use them, yet they pack a serious punch and can add valuable confluence to your trades, no matter the TFs you’re applying them on.
Before jumping in, let’s break down the basics. Volume Profile is a histogram shown vertically along the side of a price chart, plotting the total volume traded at each price level over a specific period, creating "nodes" where high or low activity took place. Key components include:
👉POC (Point of Control): The price level with the highest traded volume, often viewed as the "fair value" where buyers and sellers found the most agreement.
👉Value Area: Covers 70% of the total trading volume, bounded by VAH (Value Area High) and VAL (Value Area Low), which also act as dynamic support and resistance (S/R) levels.
👉HVN (High Volume Nodes): Zones of heavy trading activity, serving as price magnets or strong support/resistance, often aligning with the POC.
👉LVN (Low Volume Nodes): Gaps with low trading volume, where minimal activity occurs, allowing price to move through these levels quickly.
What is VRVP?
VRVP, also known as Volume Profile Visible Range, is a dynamic indicator that calculates and displays the volume profile based solely on the visible portion of your chart. As you zoom in, zoom out, or scroll, the histogram updates automatically to match your current view. It works across any TF to quickly pinpoint S/R levels or HVN/POC levels.
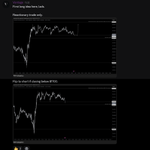
In the example below $AR, you’re looking at 3 key components:
👉VAH (Yellow Line): As noted, it acts as dynamic resistance. You can see how it could align with your trading approach for extra confluence. In this case, it lined up with HTF supply/HTF RH at $8.6, triggering a solid correction.
👉POC/HVN (Red Line): As mentioned, this serves as a pivot point where price often bounces or consolidates since it’s the level with the highest trading volume. Losing this area signals weakness. In the example, after rejecting from the VAH (resistance) at $8.6, price bounced off the POC at $7.3% before breaking below, showing bearish momentum with a clear break of structure (BOS).
👉VAL (Blue Line): Acts as dynamic support, likely where price is headed before potentially finding a bounce back to the POC or VAH.
You can see how price clearly oscillates between these 3 KLs: VAL (support) aligning with HTF demand, POC (fair value), and VAH (resistance) matching HTF supply. This provides additional confluence for your trades to hunt longs or shorts.
If you check the HTF chart (shown below), you could’ve milked this HTF range using S&D in confluence with this powerful tool for extra edge.
Let’s dive into one more example on the HTF:
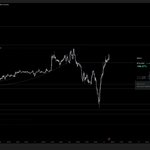
The chart below highlights:
👉VAH: Serving as resistance, capping the price below it. Acceptance above this level would flip it into support, making it a dynamic S/R zone.
👉POC: Every touch at the POC (HVN) is met with rejection here, as it’s deemed “fair value” or S/R until price breaks above and holds, turning it into support. Check the PA to the left on the chart below — price found acceptance above the POC and took off!
👉VAL: Acting as support.
You can see how these zones can be used to spot potential S/R levels or identify where maximum volume has been recorded (HVN), adding an extra layer of confluence to your trading approach.
NOTE: The VRVP indicator on TradingView requires a paid subscription — it’s not available on the free plan. However, there’s a free version I used to use by AlphaViz. You can stick with the default settings but bump up the number of ROWS to 200 for clearer volume bars.
🔨FRVP: One of my favorite tools personally—I use this more often than VRVP.
FRVP (Fixed Range Volume Profile) lets you manually select a specific price or time range on the chart and calculates the volume profile just for that fixed segment. Unlike VRVP, it’s static — once drawn, it doesn’t adjust with chart movements. You can apply it to ranges, downtrends, or uptrends on any TFs to get detailed price/volume data at each level within that swing or range.
It functions much like VRVP with the same components discussed earlier, but as noted, you can target any specific price and range to spot where maximum volume was traded. Price often PB into these volume clusters before continuing higher or lower.
Components:
👉POC: As mentioned, the price level with the highest traded volume, viewed as "fair value" where buyers and sellers aligned most.
👉Value Area: Covers 70% of total trading volume, bounded by VAH (Value Area High) and VAL (Value Area Low), which also serve as dynamic support/resistance (S/R).
How to Apply It:
💪Range: Anchor it from the origin of the range to the end (e.g., the most recent bar or a key swing point). For a horizontal range, set it from the SH to the SL to analyze volume distribution within that zone.
Trend:Identify the trend.
💪Uptrend: Anchor from SL to SH.
💪Downtrend: Anchor from SH to SL.
This reveals the highest-volume areas, often aligning with the POC, which can provide a strong entry on a PB if it coincides with your Fib levels or liquidity zones.
Example:
For a bearish swing in this example, anchor from SH to SL to reveal buyer/seller activity and where the market found fair value.
On the $MANA chart, the current volume cluster aligns with the POC, which is also a HTF partial 1D HOB with 0.5 Fib confluence and an HVN. You can see the clear reaction — bounced 42% — and now price has returned to the exact same level, this time with a 4D OB and 0.705 Fib confluence at the POC and HVN, delivering another strong reaction.
I hope you enjoyed the post and would appreciate it if you’d share it. If you’ve got any questions, feel free to drop them in the comments below.


Awesome post by @Albert_618

Failure and Growth
If you look at your version from the past and spot a lot of failures: congratulations you are experiencing Growth!
You can only change if you admit you been wrong - thats what actually leads to Growth. And thats why our priorities design the potential of it.
If your priority is to avoid failure, you probably won't experience growth at all.
Instead of trying to be right in every aspect and find the ultimate "best Answer" - it's better to work step by step on everything do wrong, that could be done better.
If see it from this perspective - Growth becomes a science.
You can project that on every aspect of life.. The moment you try to avoid failure is the moment you stop to grow.
17
2,306
bitcoin:native
Another level given to the lads earlier today. Nice 1K expansion. Couldn’t catch the short myself as I was streaming when it hit. I actually talked about it regarding the double BOS and then got busy with GOLD and other charts.
A couple of the lads caught it though.
Thanks for playing out :)


bitcoin:native
Level given to the lads about a week ago. Also flagged earlier today that we should expect an SFP of the level as it was a KL – and that’s exactly what we got.
zcash:native – Level given to the lads in advance as well. Nice little expansion. Holding with SL2BE.
$CRV – Gave the exact level a week ago as well. Personally got stopped out in profit. I’ll reassess tomorrow and see if I can get back in.


2
22
1,964
bitcoin:native
Some really nice trades on BTC for the lads in the DC.
First, there were two scalps – one long, one short. I missed both as they played out around 3am Asia time, but the lads caught them. Both were given to them on the live yesterday.
I also gave them the RB at 81,206, which has so far delivered 2,700 points of expansion. The target has almost been reached. 84,400 is the make-or-break level: acceptance above it favours continuation, whilst a rejection there could see some correction.
Let's see what we get.


teapawt.org/Trader_Vantage/status/…
bitcoin:native
Full TP for us in DC. A 4,500-point expansion from the level given.
Thanks for playing out :)


bitcoin:native
Had shared a couple of short levels with the lads in DC, and 86600 was my very low-probability short POI. That ended up delivering a 3K-point expansion, and that happens sometimes. Hit quite close to midnight, so I only managed to catch the continuation from 85500.
The target on this remains the previous weekly low.
Thanks for playing out.


1
17
2,233
bitcoin:native
Had shared a couple of short levels with the lads in DC, and 86600 was my very low-probability short POI. That ended up delivering a 3K-point expansion, and that happens sometimes. Hit quite close to midnight, so I only managed to catch the continuation from 85500.
The target on this remains the previous weekly low.
Thanks for playing out.
bitcoin:native
Shared both the long and the short levels with the lads in DC, and both have played out beautifully so far.
Long - Had given them 83900, as you can see from the screenshot below, which ended up producing a 3K-point expansion. I could not catch it myself, as it happened in the middle of the night at 2:30 Asia time. So I came up with a new continuation long and traded it into supply around 86400.
Short - Had a level marked at 86773.5, from which we saw a clean 600-point expansion. That did not result in any BOS, so I expected a M2D as price had left supply. Invalidated that immediately once I saw price pushing above it into the 86K wick supply, which gave us a clean M1D, targeting 85358, from where we are currently bouncing. :)
Thanks for playing out.


kaspa:native
Also shared the KAS short with the lads. Personally took it as a quick in-and-out, as I don’t want to leave any trades running overnight — especially on alts.


11
2,526
bitcoin:native
Gave the short level to the lads in the DC earlier today from 85600-ish. Also executed with them. Target is Monday’s/the range lows at 82400-ish. SL2BE.
Price just SFP’d the VAL of the range and is trying to put in a bounce after such an aggressive rejection. This will very likely result in a LH, which will likely take us to those range lows.
Also, had the right long idea from my refined level at 82992.2, and we were in a trade which stopped us out by a tad before it closed back in the range and sent it. And I totally missed that little PB into the OB on the m15/m5.


zcash:native
Another one given to the lads in the DC today. In fact, they’d had the demand level for about a week, I reckon — and then this morning I gave them the refined level at 1361.19 (check the screenshot), which I couldn’t catch myself, but I did catch the continuation trade, as you can see in the screenshot below.
The short that we took was closed at BE teapawt.org/Trader_Vantage/status/… and then we saw a textbook PO3 playing out. So technically the short idea was right. After getting stopped out at BE, I wanted to see a pullback into 1660 to target the DOL at 1425, which is where we would have closed the trade.


12
2,109
ethereum:0x4a220e6096b25eadb88358cb44068a3248254675
Shared it with the lads in the DC today. Hit the full technical target, but we took profit a tad early, as I didn’t like those marginal HHs — which is usually the SOW.
Thanks for playing out.


1
22
2,137
teapawt.org/Trader_Vantage/status/…
bitcoin:native
That's 2/2 with the lads.
Thanks for playing out.


bitcoin:native
Shared the local ideas with the lads earlier. It's 2/2 so far.
The short played out to perfection. And now we’re in the long, which is doing fantastically atm.
Will drop the BTC update later.


3
21
2,305
bitcoin:native
Nice little correction on BTC from the RH supply. I missed the short. I was waiting for an SFP and a break and close below it before pulling the trigger, and completely overlooked the nice M1D into RH supply, which eventually led to the expansion.
Waiting for a range to form now on the LTF from my 83996.2. Don’t want to catch the falling knife. If it goes, I’d be looking at 83600 for a long, provided MS is available.
Conversely, if I see an engulfing move plus a BOS, I might get involved.
I’ve also got my eye on 82902.3 for a potential long.
Let's see what we get.

1
29
2,225
ethereum:native [HTF]
ETH is an interesting one, imho, and one I think may have a significant run in the upcoming bull cycle. If you look at the macro, it’s mainly ranging. Should we break out of that range, you can expect a huge expansion.
It’s currently approaching my area of interest. I’ll be interested to see how price trades around this region. I’d be looking for a short lower if a setup presents itself. This isn’t necessarily a bearish view — I’m simply playing the range rotation.
If you’re holding spot, this shouldn’t change your view. You can continue adding on meaningful PBs.
Similar to BTC, I’ll be watching for that M2A forming around the 2100–1900 region for a potential swing long.
Let's see what we get.


1
33
2,177
bitcoin:native [HTF]
BTC has had a nice little expansion after SFPing the key low, and is now breaking and closing above the key high at 82,848.77.
A weekly close above this is needed to ensure this is a genuine breakout and not a potential PO3, which could also be in play should we end up SFPing here and closing back below that range high.
If we see a weekly close above the high, I think the low is very likely in. That said, I personally don’t care about being bull or bear, as I trade LTF and lower. But it’d defo be interesting times to look for some swing longs too.
From a Wyckoff perspective, someone might argue that we’ve seen an M1A, which I personally don’t like as much — not that it isn’t valid, but the time displacement between the 2nd and 3rd tap isn’t significant, and based on BTC’s past history, bottoms don’t look like that.
So what I’m expecting, should we see a weekly break and close above this RH, is a PB into 68K–72K for a HTF M2A instead. And if confirmed, we can then start looking for longs/spot, as I think that’d be the last time we might see those prices for a few years at least.
TLDR: this weekly close is of the utmost importance, and one that will very likely paint a clear picture of what’s to come next.

