

Founder of Northwise. Trying to understand technology, incentives, and where the value goes.
- Tweets97
- Following17
- Followers829
- Likes359




ALT Northwise's public Nebius 2027 operating forecast, with Bear, Base and Bull scenarios and a quarterly Base case. Revenue ranges from $19.07B to $24.61B, with $21.86B in Base. EBITDA ranges from $10.26B to $14.82B, with $12.49B in Base. Base operating cash flow is $21.60B and cash capex is $58.77B, leaving a $37.18B funding gap. The table also shows capacity, customer advances, new debt, equity and share counts. Figures are Northwise forecasts, not company guidance.


ALT Northwise exhibit, Who captures the gains from Rubin. A selected Rubin versus GB300 benchmark shows up to 3.7 times throughput. Scaling by reference rack power of 142 versus 330 kW produces an illustrative 1.592 times work per rack IT megawatt. Northwise's assumed gross rental yields of $55M versus $45M per MW give a 1.222 times revenue ratio and a 0.768 times implied price per unit of work. Actual value capture depends on customer workloads, provider execution and contract negotiations. This is conditional arithmetic using reference power, not measured benchmark energy use or an observed rental price.


ALT Conceptual diagram of planned power pathways for Nebius's Independence campus. The off-site Blue Valley / Independence Power Partners generation project connects through the SPP grid and Independence Power & Light utility supply. An arrow labeled 800 MW utility plan leads to the campus, labeled up to 1.2 GW planned. A separate dashed arrow shows a future 400 MW on-site generation option under evaluation. Planned power is not current operating capacity. The illustration is conceptual, not a photograph or as-built site plan.
ALT Northwise's public Nebius 2027 operating forecast, with Bear, Base and Bull scenarios and a quarterly Base case. Revenue ranges from $19.07B to $24.61B, with $21.86B in Base. EBITDA ranges from $10.26B to $14.82B, with $12.49B in Base. Base operating cash flow is $21.60B and cash capex is $58.77B, leaving a $37.18B funding gap. The table also shows capacity, customer advances, new debt, equity and share counts. Figures are Northwise forecasts, not company guidance.

ALT Northwise conceptual illustration for its Vineland report, with the Nebius mark over stylized energy and data center infrastructure. This is an illustration rather than a photograph of current site conditions.

ALT A wide outcome set, including failure. 27 continuing paths plus their funding-failure branches. Failure has 2.83% total weight and can wipe out equity. Probabilities are analyst judgments.

ALT A finite AI task can involve repeated model calls around external tool use. Context processing, reusable attention state and response generation have different roles. Tool execution is separate from another model inference call. The diagram is conceptual, not a hardware wiring plan.


ALT Two Northwise 2030 forecasts with the same operating business. Modeled repurchases give $3.69 normalized common EPS, 229.0 million closing common shares and $1.81 billion unrestricted cash. No additional buybacks from 2027 gives $3.50 EPS, 253.6 million shares and $3.27 billion cash. Both retain forecast second-half 2026 repurchases and a $441.8 million analyst operating reserve, which is not legally restricted cash. Future authorizations are assumptions.

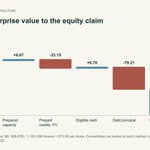
ALT From enterprise value to the equity claim. Base 2030 ARR method, $B. $88.87B / 1,183.53M shares = $75.09 per share. Convertibles are tested at each method value; blended value is $138.02.

ALT Meta's August 2026 settlement, as described in the October 9 Northwise report. Earnings: approximately $10 billion expected Q3 accounting charge. Cash: a ten-year schedule with $12.7 billion guaranteed and $5.3 billion conditional payments. Product: ongoing teen-account obligations. The accounting charge is not an additional cash-payment category.


ALT Own the compute or lease the capacity?. One 100 gross MW Sweetwater slice on 2029 costs. Landlord: $2M rent per IT MW, 80% NOI margin, 10-year lease. Not a company valuation floor.

ALT Northwise central 2030 normalized earnings forecast. Consolidated net income of $1,045.83 million less $56.75 million regular preferred dividend and $122.97 million participating preferred earnings leaves $866.11 million for common holders. Dividing by 234.58 million common and employee claims gives $3.69 EPS. Preferred participation is an earnings allocation, not an additional cash dividend. It must not also be deducted a second time through the denominator.
