

Founded one of the first synthetic grass & golf systems companies in the US in 1998. I consult on large golf systems projects world-wide. Avid crypto investor.
Joined January 2022
- Tweets15.8K
- Following482
- Followers7.9K
- Likes23.7K

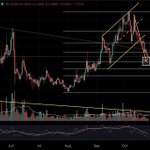




$BTC dominance is having trouble working through the upper rail of this symmetrical triangle structure. Are we about to see dominance fall to the lower rail, which would indicate a good push from alts?
Price would have to push below the midpoint level of the larger, rising parallel structure to get there as that's the more dominant structure.
A push down through the triangle itself, to the lower rail of the larger structure, would mean an even larger push by alts.
This would put price at a key level as a break through that lower rail, with price acceptance, could be the indication of the beginning of an altseason.
$altcoins #structure #analysis #TA

An $ICP push down to $2.50 at the .618 fib level is reasonable, in my target zone, and still maintains a higher low with the overall uptrend on the daily chart.

$LTC is still putting in higher highs and higher lows since it's price reversal around $39. Price can still fall to the bottom of the box and maintain a higher low.

algorand:native is doing a nice job of price acceptance above the .5 fib level. It has two daily candle body closes above that level and currently working on a third today. I want to see a full body candle close by the end of the daily today.

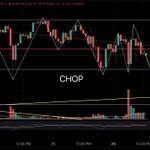
#CHOP is to be expected when transitioning from a bear to a bull. Several wicks indicate leverage trading liquidation probes.
Will we see a push down to the 9 year macro trend rail for $BTC or not? Hard to say but I would expect one more retest as more likely than not.
The rest of the alts that I have been tracking closely ($LTC, algorand:native, $ICP) have hit my target zones except for $ZEC. I'd feel a lot more comfortable about the structure of Zcash if it would at least retest the 1K area!
The Fed meeting on rate cuts could keep us in this chop range until the day of that decision on Wednesday.

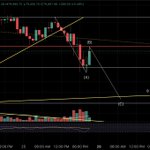
I'm looking for an ABC corrective pattern down to the 9 year macro trend support for $BTC. My primary target all along has been around $78,500. Let's see how this plays out:)

I posted months ago about silver most likely coming back to retest the macro cup and handle break out at $50 eventually. Current price is $3 from that level.
This is also a big indicator to me that we are about to see the lows in this current pullback in all markets. A 46 year structure that is near perfection, and playing out to the T, doesn't lie!

Focus on the bullish RSI divergence on the 4H chart for $BTC. RSI is rising while the price has been relatively flat within a small range. That is an indicator of an asset that isn't going to go much lower in price in my analysis.
There are three areas of major confluence at my general target:
- The .702 fib retracement
- Two structural rails, one being a 9 year support level.
Even if Bitcoin pushes down to my target area, that won't be enough to reverse the overall RSI trend.
I still think a bottom is near with this correction as this could end up being your classic weekend bear trap followed by a reversal on Monday.
As always, let's see how it all plays out:)

This looks to be setting up as a Livermore pivot retest of the structure midpoint from underneath for $BTC.
Watch spot candle volume if and when it hits that level.

Here's the macro structure for $BTC once again. You can see why I'm pretty confident that price will hold in the general area that it's currently at, even if we see a small push below the lower rail of this macro rising wedge structure:)

I haven't talked about $IOTA for quite some time as it's been a longer term hold for me. This is exactly what you want to see as far as structure goes.
It's a macro falling wedge pattern combined with very bullish RSI divergence since May of 2022 on the daily chart.

The $ZEC price has worked just below the .786 trend based fib chart. My expectations are still a minimum correction to around the 1K level as that would be the healthiest behavior. If it doesn't do that now, it could certainly fall much harder later.
Will it push below 1K to the lower target around $700? Hard to say at this point but if it's following the general market trend currently, and that trend is about to bottom, then 1K would probably be as low as price goes.
If the entire market continues to correct, well below the target areas I have for most of the assets I'm following, then everything will have to be re-evaluated at that point and Zcash could easily hit the lower target.
I don't expect a larger market correction, but if that happens, it would indicate a much weaker market than I thought.

$LTC price has now pushed into the target zone I've had for it, below the local rising trend line. Let's see how low it goes as anywhere within the box is what I've expected.

$ICP price has now wicked into my target area. $2.50 would be the logical, psychological price target within the box if it continues to correct.

Since price has now pushed slightly below the .5 fib level for algorand:native, I wanted to make a quick note on the cup-and-handle structure because this is an important part of how I evaluate these patterns.
I’ve always said that, ideally, you do not want to see the handle retrace more than about 50% of the depth of the cup.
On this chart, my Fib is anchored from the cup bottom around $0.076 to the rim/high around $0.140, so the .50 Fib near $0.103 is the actual halfway point of the cup.
That makes this current area very important.
If ALGO holds around the .50 and reverses, the structure remains much cleaner and more textbook.
If price drops toward the .618 around $0.096, I would not say the entire bullish structure is dead, but the traditional cup-and-handle interpretation becomes much weaker because the handle is retracing too deeply.
And if price starts working down toward the .702–.786 area around $0.091–$0.087, I would probably stop calling it a traditional cup-and-handle altogether and reassess the structure.
That’s the distinction I think is important:
A deeper retracement can weaken or invalidate the pattern without necessarily invalidating the larger bullish market structure.
For now, the .50 is the level I’m watching.
#ALGO #Algorand #Crypto #TechnicalAnalysis #CupAndHandle #Fibonacci #MarketStructure #PriceAction #TradingView

Most alts I am tracking have hit or are hitting the target areas I had for them, around the time I had estimated, between yesterday and Sunday. Again, time is incredibly difficult to predict but this has played out pretty well so far.
$BTC has broken the neckline of the small H&S pattern it was in and is currently falling towards my target as well. The 9 Year trend support line is the key support structure. Price could wick below it but how it reacts on a reclaim of that support is what to watch.
My price target has always been somewhere around 78K. Price has dipped to $79,707 so far. Most are calling for 75K or even lower. Price doesn't typically do what the "mob" is calling for so we will see what happens soon!

$LTC has tapped the top of my target zone right where an ascending trend line crosses that point. Is this as low as price goes? Only the crypto Gods know that:)

$BTC has formed a small head and shoulders structure and price has tapped the neckline twice, which happens to also be in confluence with the parallel channel midpoint.
If this executes and a measured move plays out, that takes price to the bottom of the target zone. Time is what what's hard to predict.

