

U.S. Sector Strategist @NDR_Research | @Mizzou
St Louis, MO
Joined December 2020
- Tweets609
- Following237
- Followers8.7K
- Likes2.8K



Technology's drawdown vs. SPX reached 12% over 21 trading days, the worst stretch over the period since 2001.

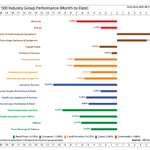
For perspective, this has been the sixth Nasdaq selloff of more than 9% since the 2022 low (now at 11.9%). Outside of Liberation Day, the max drawdown was around 13%. The current Semi drawdown at 29% is in line with Liberation Day. Many non-tech industry groups are holding up.

Rob Anderson retweeted

I always loved this chart from @NDR_Research, which shows that owning the largest stock in the S&P 500 has historically been a terrible strategy, relative to just owning the index.

The top two performing sectors in any given year have typically moved together. That has not been the case with Energy and Technology in 2026, with the one-year correlation well into negative territory.


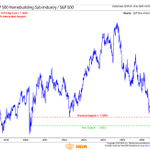
Rising yields have been crushing many rate sensitive equities. Homebuilders are trading at the lowest levels vs. the S&P 500 since COVID.

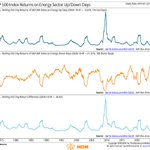
The Energy sector has never mattered more for stock market returns. Over the last 252-days (one year) the S&P 500 lost 5.5% on Energy up days, a record low. The index gained 21.3% on Energy down days, a record high.

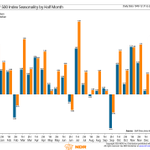
The second half of September has tended to be the most bearish half month of the year by average and median returns.

The Fed’s Financial Accounts report for Q2 showed equity holdings for households jumped to 53% of total household financial assets during the quarter, a record high.

For most of the last three years, rising oil prices weren't a major drag on equities. That changed following the bombing of Iran, with the correlation between stocks and crude turning negative in March and remaining there since.

The S&P 500 has rarely traded outside of its nearly 100-year trend channel. While the weight-of-the-evidence still supports equities, the overshoot adds to a growing list of indicators suggesting a late-cycle environment.


The correlation between stocks and bond yields turned negative shortly after the start of the war with Iran. The relationship has strengthened since then, with the six-month correlation currently at its most negative reading since 1997.

Gold's message on fiscal policy has been pretty clear. Since 1980, gold has returned 7.2% annualized when the U.S. budget balance was deteriorating, versus a 2.0% gain when it was improving. The debasement trade should remain a long-term tailwind for gold.

Less than 5% of S&P 500 stocks yield more than the 10-year Treasury yield, the fewest since May 2007.

Utilities has not been much of an AI beneficiary. The sector's weight in the S&P 500 fell below 2.0% for the first time on record at the end of August.

Several sectors have tracked their cycle composites remarkably closely this year. The current message is more defensive leadership in the near term followed by a cyclical rotation.
For Health Care, the composite trends up through the election and fades into year end. 1/9

The Communication Services Cycle Composite is generally positive, but choppy. The composite bottoms in early September, rallies through October, sells off in November, and rallies to close out 2026. 8/9

1
7
597
