

Where Aeronautics meet AstroEconomics. Macro, SPY and VIX focus. Home of VAXTRO, ORM Oscillator, and VIX Ladder. Premium Content / Substack Members: Link Below.
Garden City, MI
Joined September 2016
- Tweets16.8K
- Following241
- Followers21.3K
- Likes13.4K



Pinned Tweet
$SOXX — 𝗧𝗼 𝗧𝗵𝗼𝘀𝗲 𝗪𝗵𝗼 𝗗𝗼𝘂𝗯𝘁 𝗧𝗵𝗲 𝗕𝗼𝘁𝘁𝗼𝗺. 11/01/26
𝗬𝗲𝘀, the May–November rising support (maroon line) has broken. Even the much older ascending black trendline has been violated. But 𝗱𝗼𝗻'𝘁 𝗰𝗼𝗻𝗳𝘂𝘀𝗲 𝗮 𝗯𝗿𝗼𝗸𝗲𝗻 𝘀𝘁𝗿𝘂𝗰𝘁𝘂𝗿𝗲 𝘄𝗶𝘁𝗵 𝗮 𝗯𝗿𝗼𝗸𝗲𝗻 𝗺𝗮𝗿𝗸𝗲𝘁.
𝗧𝗵𝗲 𝗿𝗲𝗮𝗹 𝘀𝘁𝗼𝗿𝘆 𝗶𝘀 𝘁𝗵𝗲 𝗩𝗪𝗔𝗣. My anchored VWAP near $459.40 caught Friday's capitulation wick almost perfectly. Price rebounded roughly $14 from that level into the close. See the red ellipse and where price bottomed; perfection!
As discussed yesterday, $SOXL's net volume surged from −20% to +5% during the final two trading hours. That is a remarkable shift in buying pressure amid apparent technical destruction and fear.
𝗠𝘆 𝗶𝗻𝘁𝗲𝗿𝗽𝗿𝗲𝘁𝗮𝘁𝗶𝗼𝗻: Capitulation, absorption, and a potential transfer of control back to buyers.
𝗧𝗵𝗲 𝗯𝗲𝗮𝗿𝘀 𝘀𝗲𝗲 𝗯𝗿𝗼𝗸𝗲𝗻 𝗹𝗶𝗻𝗲𝘀. 𝗜 𝘀𝗲𝗲 𝗮 𝗩𝗪𝗔𝗣 𝗱𝗲𝗳𝗲𝗻𝗱𝗲𝗱. As long as ~$459 holds, the opportunity remains for $SOXX to reclaim the broken trendlines and reenter the upper triangular structure.
𝗧𝗼𝗱𝗮𝘆'𝘀 𝗯𝗿𝗲𝗮𝗸𝗱𝗼𝘄𝗻 𝗰𝗼𝘂𝗹𝗱 𝗯𝗲 𝘁𝗼𝗺𝗼𝗿𝗿𝗼𝘄'𝘀 𝗯𝗲𝗮𝗿 𝘁𝗿𝗮𝗽.
I'm constructive on $SOXX and $SOXL. The VWAP is my line in the sand. The market maker will provide you with the bullish narrative leading into the midterms.
Share & Subscribe, <link in bio>.
$SPY $QQQ $IWM $MDY $RUT $DIA $SDOW $SOXX $SOXS $SMH $NVDA $TSLA $YINN $VIX $VXX $TLT $BTC $GLD $SLV $SVXY $DRAM $SNDK $MU $EWJ $EWY

Astro Zan retweeted
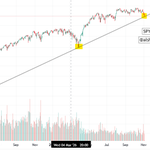
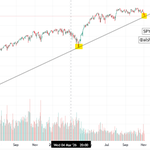
⚠️⚠️⚠️ 𝗪𝗵𝘆 $SPY 𝗖𝗮𝗽𝗶𝘁𝘂𝗹𝗮𝘁𝗶𝗼𝗻 𝗜𝘀 𝗜𝗺𝗺𝗶𝗻𝗲𝗻𝘁! | 𝟭𝟭/𝟬𝟯/𝟮𝟲
Tonight, history may be in the making.
Three pivotal market lows, separated by time but united by geometry:
🔸 The April 2025 Liberation Day low.
🔸 The 2026 Ceasefire low. 03/30
🔸 Tonight's $SPY low.
𝗧𝗵𝗿𝗲𝗲 𝗹𝗼𝘄𝘀. 𝗢𝗻𝗲 𝗮𝘀𝗰𝗲𝗻𝗱𝗶𝗻𝗴 𝘀𝘂𝗽𝗽𝗼𝗿𝘁 𝗹𝗶𝗻𝗲.
The chart reveals an extraordinary geometric alignment, with $SPY once again testing the very trendline that has defined this bull market's structural foundation.
My expectation: downside is complete, seeing is believing ✅
Share & Subscribe, <link in bio>.
$SPY $QQQ $IWM $MDY $RUT $DIA $SDOW $SOXX $SOXS $SMH $NVDA $TSLA $YINN $VIX $VXX $TLT $BTC $GLD $SLV $SVXY $DRAM $SNDK $MU $EWJ $EWY

Astro Zan retweeted
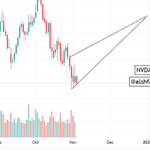
$NVDA — 𝗠𝘆 𝗦𝗵𝗼𝗿𝘁-𝗧𝗲𝗿𝗺 𝗣𝗿𝗶𝗰𝗲 𝗧𝗮𝗿𝗴𝗲𝘁𝘀 | 𝟭𝟭/𝟬𝟯/𝟮𝟲
Yes, even in the midst of overnight market fear, with $SPY trading near $747 and potentially testing $743 by the opening bell, I remain bullish on $NVDA and $SOXX from the current VWAP level.
With a potential #VIX1D volatility crush on deck at cash open Wed AM, my short-term forecasts are:
🎯 $215 by Friday, November 6.
🎯 $220 by Monday, November 9.
The chart tells the story. $NVDA is approaching a critical ascending support line, and I expect that line to 𝗛𝗢𝗟𝗗.
The geometry favors a rebound, not a breakdown.
𝗙𝗲𝗮𝗿 𝗶𝘀 𝗵𝗶𝗴𝗵. 𝗠𝘆 𝘁𝗮𝗿𝗴𝗲𝘁𝘀 𝗮𝗿𝗲 𝗵𝗶𝗴𝗵𝗲𝗿.
Share & Subscribe, <link in bio>.
$SPY $QQQ $IWM $MDY $RUT $DIA $SDOW $SOXX $SOXS $SMH $NVDA $TSLA $YINN $VIX $VXX $TLT $BTC $GLD $SLV $SVXY $DRAM $SNDK $MU $EWJ $EWY

⚠️⚠️⚠️ 𝗪𝗵𝘆 $SPY 𝗖𝗮𝗽𝗶𝘁𝘂𝗹𝗮𝘁𝗶𝗼𝗻 𝗜𝘀 𝗜𝗺𝗺𝗶𝗻𝗲𝗻𝘁! | 𝟭𝟭/𝟬𝟯/𝟮𝟲
Tonight, history may be in the making.
Three pivotal market lows, separated by time but united by geometry:
🔸 The April 2025 Liberation Day low.
🔸 The 2026 Ceasefire low. 03/30
🔸 Tonight's $SPY low.
𝗧𝗵𝗿𝗲𝗲 𝗹𝗼𝘄𝘀. 𝗢𝗻𝗲 𝗮𝘀𝗰𝗲𝗻𝗱𝗶𝗻𝗴 𝘀𝘂𝗽𝗽𝗼𝗿𝘁 𝗹𝗶𝗻𝗲.
The chart reveals an extraordinary geometric alignment, with $SPY once again testing the very trendline that has defined this bull market's structural foundation.
My expectation: downside is complete, seeing is believing ✅
Share & Subscribe, <link in bio>.
$SPY $QQQ $IWM $MDY $RUT $DIA $SDOW $SOXX $SOXS $SMH $NVDA $TSLA $YINN $VIX $VXX $TLT $BTC $GLD $SLV $SVXY $DRAM $SNDK $MU $EWJ $EWY
$NVDA — 𝗠𝘆 𝗦𝗵𝗼𝗿𝘁-𝗧𝗲𝗿𝗺 𝗣𝗿𝗶𝗰𝗲 𝗧𝗮𝗿𝗴𝗲𝘁𝘀 | 𝟭𝟭/𝟬𝟯/𝟮𝟲
Yes, even in the midst of overnight market fear, with $SPY trading near $747 and potentially testing $743 by the opening bell, I remain bullish on $NVDA and $SOXX from the current VWAP level.
With a potential #VIX1D volatility crush on deck at cash open Wed AM, my short-term forecasts are:
🎯 $215 by Friday, November 6.
🎯 $220 by Monday, November 9.
The chart tells the story. $NVDA is approaching a critical ascending support line, and I expect that line to 𝗛𝗢𝗟𝗗.
The geometry favors a rebound, not a breakdown.
𝗙𝗲𝗮𝗿 𝗶𝘀 𝗵𝗶𝗴𝗵. 𝗠𝘆 𝘁𝗮𝗿𝗴𝗲𝘁𝘀 𝗮𝗿𝗲 𝗵𝗶𝗴𝗵𝗲𝗿.
Share & Subscribe, <link in bio>.
$SPY $QQQ $IWM $MDY $RUT $DIA $SDOW $SOXX $SOXS $SMH $NVDA $TSLA $YINN $VIX $VXX $TLT $BTC $GLD $SLV $SVXY $DRAM $SNDK $MU $EWJ $EWY
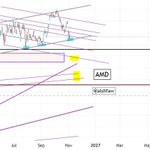
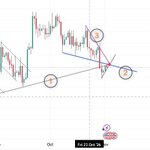
$AMD Pre-Earnings Picture.
- See blue marks, price is currently supported by May to November support line.
- Losing this line with earnings will open a major pandora's box: Lower gap at $365, and all the way down to 1.618 FIB at $325, that order book on the way up was thin. Losing blue marks line is risky for the bulls. See pic. Must protect the blue marks line ⚠️⚠️
Share & Subscribe, <link in bio>.
$SPY $QQQ $IWM $MDY $RUT $DIA $SDOW $SOXX $SOXS $SMH $NVDA $TSLA $YINN $VIX $VXX $TLT $BTC $GLD $SLV $SVXY $DRAM $SNDK $MU $EWJ $EWY

Astro Zan retweeted
𝗦𝗣𝗬 𝗔𝗻𝗮𝗹𝘆𝘀𝗶𝘀 — 𝟭𝟭/𝟬𝟯/𝟮𝟲
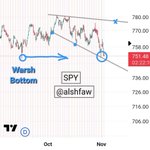
$SPY — 𝗧𝗵𝗲 𝗪𝗮𝗿𝘀𝗵 𝗕𝗼𝘁𝘁𝗼𝗺: 𝗧𝗵𝗲 𝗟𝗶𝗻𝗲 𝗶𝗻 𝘁𝗵𝗲 𝗦𝗮𝗻𝗱.
• The 9/16 Warsh Bottom remains the critical line in the sand. See chart.
• 𝗙𝗿𝗶𝗱𝗮𝘆'𝘀 𝗹𝗼𝘄 = 𝗧𝗼𝗻𝗶𝗴𝗵𝘁'𝘀 𝗹𝗼𝘄 = 𝗪𝗮𝗿𝘀𝗵'𝘀 𝗹𝗼𝘄. Three tests, one defining support level.
• The optimist sees a 𝘁𝗿𝗶𝗽𝗹𝗲 𝗯𝗼𝘁𝘁𝗼𝗺 forming — a potentially powerful reversal structure.
• Capitulation remains possible, including an intraday flush below support to shake out the remaining weak hands.
• 𝗕𝘂𝘁 𝗵𝗲𝗿𝗲 𝗶𝘀 𝗺𝘆 𝗰𝗼𝗻𝘃𝗶𝗰𝘁𝗶𝗼𝗻: On a closing basis, I expect the 𝗕𝗶𝗴 𝗪𝗵𝗲𝗲𝗹'𝘀 𝗕𝗼𝘁𝘁𝗼𝗺 to continue holding.
𝗜𝗻𝘁𝗿𝗮𝗱𝗮𝘆 𝗰𝗮𝗽𝗶𝘁𝘂𝗹𝗮𝘁𝗶𝗼𝗻 𝗶𝘀 𝗻𝗼𝘁 𝘁𝗵𝗲 𝘀𝗮𝗺𝗲 𝗮𝘀 𝗮 𝗰𝗼𝗻𝗳𝗶𝗿𝗺𝗲𝗱 𝗯𝗿𝗲𝗮𝗸𝗱𝗼𝘄𝗻.
Note broadening formation.
Share & Subscribe, <<link in bio>>.
$SPY $QQQ $IWM $MDY $RUT $DIA $SDOW $SOXX $SOXS $SMH $NVDA $TSLA $YINN $VIX $VXX $TLT $BTC $GLD $SLV $SVXY

𝗦𝗣𝗬 𝗔𝗻𝗮𝗹𝘆𝘀𝗶𝘀 — 𝟭𝟭/𝟬𝟯/𝟮𝟲
$SPY — 𝗧𝗵𝗲 𝗪𝗮𝗿𝘀𝗵 𝗕𝗼𝘁𝘁𝗼𝗺: 𝗧𝗵𝗲 𝗟𝗶𝗻𝗲 𝗶𝗻 𝘁𝗵𝗲 𝗦𝗮𝗻𝗱.
• The 9/16 Warsh Bottom remains the critical line in the sand. See chart.
• 𝗙𝗿𝗶𝗱𝗮𝘆'𝘀 𝗹𝗼𝘄 = 𝗧𝗼𝗻𝗶𝗴𝗵𝘁'𝘀 𝗹𝗼𝘄 = 𝗪𝗮𝗿𝘀𝗵'𝘀 𝗹𝗼𝘄. Three tests, one defining support level.
• The optimist sees a 𝘁𝗿𝗶𝗽𝗹𝗲 𝗯𝗼𝘁𝘁𝗼𝗺 forming — a potentially powerful reversal structure.
• Capitulation remains possible, including an intraday flush below support to shake out the remaining weak hands.
• 𝗕𝘂𝘁 𝗵𝗲𝗿𝗲 𝗶𝘀 𝗺𝘆 𝗰𝗼𝗻𝘃𝗶𝗰𝘁𝗶𝗼𝗻: On a closing basis, I expect the 𝗕𝗶𝗴 𝗪𝗵𝗲𝗲𝗹'𝘀 𝗕𝗼𝘁𝘁𝗼𝗺 to continue holding.
𝗜𝗻𝘁𝗿𝗮𝗱𝗮𝘆 𝗰𝗮𝗽𝗶𝘁𝘂𝗹𝗮𝘁𝗶𝗼𝗻 𝗶𝘀 𝗻𝗼𝘁 𝘁𝗵𝗲 𝘀𝗮𝗺𝗲 𝗮𝘀 𝗮 𝗰𝗼𝗻𝗳𝗶𝗿𝗺𝗲𝗱 𝗯𝗿𝗲𝗮𝗸𝗱𝗼𝘄𝗻.
Note broadening formation.
Share & Subscribe, <<link in bio>>.
$SPY $QQQ $IWM $MDY $RUT $DIA $SDOW $SOXX $SOXS $SMH $NVDA $TSLA $YINN $VIX $VXX $TLT $BTC $GLD $SLV $SVXY
$AAPL First post earnings move was to $333, as shown below. Exactly as shown.
From here, losing $333 opens the door for $325 long term support, see picture.
I prefer that AAPL goes to $325 to provide very strong bullish support to $QQQ $SPY going forward. Retest longer term.

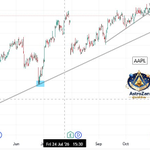
𝗔𝗣𝗣𝗟𝗘 $AAPL — 𝗣𝗥𝗘-𝗘𝗔𝗥𝗡𝗜𝗡𝗚𝗦 𝗚𝗘𝗢𝗠𝗘𝗧𝗥𝗜𝗖 𝗦𝗘𝗧𝗨𝗣 📐11/02/26
Apple is approaching a critical technical juncture ahead of its earnings report, with a potentially important bottom taking shape shortly.
🔹 𝗧𝗵𝗲 𝗟𝗼𝗻𝗴-𝗧𝗲𝗿𝗺 𝗦𝘂𝗽𝗽𝗼𝗿𝘁
The ascending gray trendline, anchored to the April 2026 ceasefire low and validated by the June retest, has governed Apple's bullish structure for months. See the blue markers.
Price has respected this foundation ever since.
🔹 𝗧𝗵𝗲 𝗦𝗵𝗼𝗿𝘁-𝗧𝗲𝗿𝗺 𝗖𝗼𝗿𝗿𝗲𝗰𝘁𝗶𝗼𝗻
Today's decline suggests $AAPL is following a newly developing descending wedge, with a projected apex near $333–$334.
This is my first potential reversal zone.
🔹 𝗧𝗵𝗲 𝗘𝗮𝗿𝗻𝗶𝗻𝗴𝘀 𝗪𝗶𝗹𝗱𝗰𝗮𝗿𝗱
Should the earnings reaction prove unfavorable, Apple has room to decline toward $325, where the long-term ascending support awaits.
That would represent a deeper structural retest, 𝗻𝗼𝘁 𝗻𝗲𝗰𝗲𝘀𝘀𝗮𝗿𝗶𝗹𝘆 𝗮 𝗯𝗿𝗲𝗮𝗸𝗱𝗼𝘄𝗻.
🔹 𝗧𝗵𝗲 𝗕𝘂𝗹𝗹𝗶𝘀𝗵 𝗥𝗼𝗮𝗱𝗺𝗮𝗽
① $333–$334: Initial reversal candidate.
② $325: Secondary support if earnings trigger additional selling.
③ 𝗡𝗲𝘄 𝗔𝗹𝗹-𝗧𝗶𝗺𝗲 𝗛𝗶𝗴𝗵𝘀: The preferred subsequent upside scenario, provided the long-term structure holds.
🎯 𝗧𝗵𝗲 𝗕𝗶𝗴𝗴𝗲𝗿 𝗣𝗶𝗰𝘁𝘂𝗿𝗲
My expectation is that $AAPL will establish its bottom shortly after $SPY establishes its own (SPY happened), setting the stage for another bullish impulse.
𝗧𝗵𝗲 𝗲𝗮𝗿𝗻𝗶𝗻𝗴𝘀 𝗿𝗲𝗮𝗰𝘁𝗶𝗼𝗻 𝗺𝗮𝘆 𝗱𝗲𝘁𝗲𝗿𝗺𝗶𝗻𝗲 𝗵𝗼𝘄 𝗱𝗲𝗲𝗽 𝘁𝗵𝗲 𝗿𝗲𝘁𝗲𝘀𝘁 𝗴𝗼𝗲𝘀 — 𝗯𝘂𝘁 𝘁𝗵𝗲 𝗴𝗲𝗼𝗺𝗲𝘁𝗿𝘆 𝘀𝘁𝗶𝗹𝗹 𝗳𝗮𝘃𝗼𝗿𝘀 𝗮 𝗯𝘂𝗹𝗹𝗶𝘀𝗵 𝗿𝗲𝘀𝗼𝗹𝘂𝘁𝗶𝗼𝗻.
If you see $AAPL at $325, buy there. $333 can but may not hold until long term support is tested at $325.
Share & Subscribe, <link in bio>.
$SPY $QQQ $IWM $MDY $RUT $DIA $SDOW $SOXX $SOXS $SMH $NVDA $TSLA $YINN $VIX $VXX $TLT $BTC $GLD $SLV $SVXY $DRAM $SNDK $MU $EWJ $EWY


𝗔𝗣𝗣𝗟𝗘 $AAPL — 𝗣𝗥𝗘-𝗘𝗔𝗥𝗡𝗜𝗡𝗚𝗦 𝗚𝗘𝗢𝗠𝗘𝗧𝗥𝗜𝗖 𝗦𝗘𝗧𝗨𝗣 📐11/02/26
Apple is approaching a critical technical juncture ahead of its earnings report, with a potentially important bottom taking shape shortly.
🔹 𝗧𝗵𝗲 𝗟𝗼𝗻𝗴-𝗧𝗲𝗿𝗺 𝗦𝘂𝗽𝗽𝗼𝗿𝘁
The ascending gray trendline, anchored to the April 2026 ceasefire low and validated by the June retest, has governed Apple's bullish structure for months. See the blue markers.
Price has respected this foundation ever since.
🔹 𝗧𝗵𝗲 𝗦𝗵𝗼𝗿𝘁-𝗧𝗲𝗿𝗺 𝗖𝗼𝗿𝗿𝗲𝗰𝘁𝗶𝗼𝗻
Today's decline suggests $AAPL is following a newly developing descending wedge, with a projected apex near $333–$334.
This is my first potential reversal zone.
🔹 𝗧𝗵𝗲 𝗘𝗮𝗿𝗻𝗶𝗻𝗴𝘀 𝗪𝗶𝗹𝗱𝗰𝗮𝗿𝗱
Should the earnings reaction prove unfavorable, Apple has room to decline toward $325, where the long-term ascending support awaits.
That would represent a deeper structural retest, 𝗻𝗼𝘁 𝗻𝗲𝗰𝗲𝘀𝘀𝗮𝗿𝗶𝗹𝘆 𝗮 𝗯𝗿𝗲𝗮𝗸𝗱𝗼𝘄𝗻.
🔹 𝗧𝗵𝗲 𝗕𝘂𝗹𝗹𝗶𝘀𝗵 𝗥𝗼𝗮𝗱𝗺𝗮𝗽
① $333–$334: Initial reversal candidate.
② $325: Secondary support if earnings trigger additional selling.
③ 𝗡𝗲𝘄 𝗔𝗹𝗹-𝗧𝗶𝗺𝗲 𝗛𝗶𝗴𝗵𝘀: The preferred subsequent upside scenario, provided the long-term structure holds.
🎯 𝗧𝗵𝗲 𝗕𝗶𝗴𝗴𝗲𝗿 𝗣𝗶𝗰𝘁𝘂𝗿𝗲
My expectation is that $AAPL will establish its bottom shortly after $SPY establishes its own (SPY happened), setting the stage for another bullish impulse.
𝗧𝗵𝗲 𝗲𝗮𝗿𝗻𝗶𝗻𝗴𝘀 𝗿𝗲𝗮𝗰𝘁𝗶𝗼𝗻 𝗺𝗮𝘆 𝗱𝗲𝘁𝗲𝗿𝗺𝗶𝗻𝗲 𝗵𝗼𝘄 𝗱𝗲𝗲𝗽 𝘁𝗵𝗲 𝗿𝗲𝘁𝗲𝘀𝘁 𝗴𝗼𝗲𝘀 — 𝗯𝘂𝘁 𝘁𝗵𝗲 𝗴𝗲𝗼𝗺𝗲𝘁𝗿𝘆 𝘀𝘁𝗶𝗹𝗹 𝗳𝗮𝘃𝗼𝗿𝘀 𝗮 𝗯𝘂𝗹𝗹𝗶𝘀𝗵 𝗿𝗲𝘀𝗼𝗹𝘂𝘁𝗶𝗼𝗻.
If you see $AAPL at $325, buy there. $333 can but may not hold until long term support is tested at $325.
Share & Subscribe, <link in bio>.
$SPY $QQQ $IWM $MDY $RUT $DIA $SDOW $SOXX $SOXS $SMH $NVDA $TSLA $YINN $VIX $VXX $TLT $BTC $GLD $SLV $SVXY $DRAM $SNDK $MU $EWJ $EWY
Astro Zan retweeted
₿ $BTC BITCOIN — THE POWER OF THREE. 11/01/26
Three Lines. One Date. One Confluence.
There is something extraordinary about the geometry unfolding in $BTC ahead of Election Day, November 3.
Three independent trendlines are converging at virtually the same point:
① Long-term ascending support — the foundation of the broader structure.
② Recent declining support — defining the latest corrective phase.
③ Descending resistance — the upper boundary pressing down on price.
🔺 All three converge at the RED DOT, precisely on Election Day. See the chart.
This is a rare geometric alignment, where three separate price structures meet at a potentially important calendar catalyst.
The power of THREE should not be underestimated.
Even more interesting, $BTC is already attempting to reverse from an absorption wick, suggesting buyers are defending the lower boundary.
⚠️ A word of caution: Exhaustion is only around Sell 1–2 level, and volume remains unremarkable. This may not be an explosive event. The reversal could develop gradually absent a huge catalyst leading into the midterms.
Nevertheless, the geometry favors an UPWARD directional impulse from the confluence point, provided support holds.
Election Day may serve as the catalyst, but the geometry is already broadcasting the message.
Three lines. One intersection. A potential turning point.
Important level higher: $81k.
Share & Subscribe, <link in bio>.
$SPY $QQQ $IWM $MDY $RUT $DIA $SDOW $SOXX $SOXS $SMH $NVDA $TSLA $YINN $VIX $VXX $TLT $BTC $GLD $SLV $SVXY $DRAM $SNDK $MU $EWJ $EWY $SOL $ETHA $IBIT $SBIT

Astro Zan retweeted
$SOXX — 𝗧𝗼 𝗧𝗵𝗼𝘀𝗲 𝗪𝗵𝗼 𝗗𝗼𝘂𝗯𝘁 𝗧𝗵𝗲 𝗕𝗼𝘁𝘁𝗼𝗺. 11/01/26
𝗬𝗲𝘀, the May–November rising support (maroon line) has broken. Even the much older ascending black trendline has been violated. But 𝗱𝗼𝗻'𝘁 𝗰𝗼𝗻𝗳𝘂𝘀𝗲 𝗮 𝗯𝗿𝗼𝗸𝗲𝗻 𝘀𝘁𝗿𝘂𝗰𝘁𝘂𝗿𝗲 𝘄𝗶𝘁𝗵 𝗮 𝗯𝗿𝗼𝗸𝗲𝗻 𝗺𝗮𝗿𝗸𝗲𝘁.
𝗧𝗵𝗲 𝗿𝗲𝗮𝗹 𝘀𝘁𝗼𝗿𝘆 𝗶𝘀 𝘁𝗵𝗲 𝗩𝗪𝗔𝗣. My anchored VWAP near $459.40 caught Friday's capitulation wick almost perfectly. Price rebounded roughly $14 from that level into the close. See the red ellipse and where price bottomed; perfection!
As discussed yesterday, $SOXL's net volume surged from −20% to +5% during the final two trading hours. That is a remarkable shift in buying pressure amid apparent technical destruction and fear.
𝗠𝘆 𝗶𝗻𝘁𝗲𝗿𝗽𝗿𝗲𝘁𝗮𝘁𝗶𝗼𝗻: Capitulation, absorption, and a potential transfer of control back to buyers.
𝗧𝗵𝗲 𝗯𝗲𝗮𝗿𝘀 𝘀𝗲𝗲 𝗯𝗿𝗼𝗸𝗲𝗻 𝗹𝗶𝗻𝗲𝘀. 𝗜 𝘀𝗲𝗲 𝗮 𝗩𝗪𝗔𝗣 𝗱𝗲𝗳𝗲𝗻𝗱𝗲𝗱. As long as ~$459 holds, the opportunity remains for $SOXX to reclaim the broken trendlines and reenter the upper triangular structure.
𝗧𝗼𝗱𝗮𝘆'𝘀 𝗯𝗿𝗲𝗮𝗸𝗱𝗼𝘄𝗻 𝗰𝗼𝘂𝗹𝗱 𝗯𝗲 𝘁𝗼𝗺𝗼𝗿𝗿𝗼𝘄'𝘀 𝗯𝗲𝗮𝗿 𝘁𝗿𝗮𝗽.
I'm constructive on $SOXX and $SOXL. The VWAP is my line in the sand. The market maker will provide you with the bullish narrative leading into the midterms.
Share & Subscribe, <link in bio>.
$SPY $QQQ $IWM $MDY $RUT $DIA $SDOW $SOXX $SOXS $SMH $NVDA $TSLA $YINN $VIX $VXX $TLT $BTC $GLD $SLV $SVXY $DRAM $SNDK $MU $EWJ $EWY
$HSI / 𝗖𝗛𝗜𝗡𝗘𝗦𝗘 𝗦𝗧𝗢𝗖𝗞𝗦 — 𝗧𝗛𝗘 𝗕𝗢𝗧𝗧𝗢𝗠 𝗜𝗦 𝗜𝗡! 🇨🇳
🔹 𝗧𝗵𝗲 𝗥𝗶𝗴𝗵𝘁 𝗦𝗵𝗼𝘂𝗹𝗱𝗲𝗿 𝗜𝘀 𝗙𝗼𝗿𝗺𝗶𝗻𝗴 𝗛𝗶𝗴𝗵𝗲𝗿.
$HSI is constructing a potentially powerful reversal, with the right shoulder forming near 23,000 versus approximately 22,500 for the left shoulder.
🔹 𝗔𝗱𝘃𝗮𝗻𝗰𝗲𝗱 𝗚𝗲𝗼𝗺𝗲𝘁𝗿𝗶𝗰 𝗘𝗻𝗴𝗶𝗻𝗲𝗲𝗿𝗶𝗻𝗴 — 𝗔𝘀𝘁𝗿𝗼𝗭𝗮𝗻
Two critical geometric lines govern the entire price structure. This advanced geometric construction incorporates engineering concepts by AstroZan to identify structural support, resistance, and directional impulses.
🔹 𝗧𝗵𝗲 𝗥𝗼𝗮𝗱𝗺𝗮𝗽:
① First resistance at the cyan ascending trendline, followed by a potential retest lower.
② Once price reclaims the cyan line and re-enters the original wedge, the structure turns decisively more bullish.
③ 𝗧𝗵𝗲 𝗺𝗮𝗶𝗻 𝘂𝗽𝘄𝗮𝗿𝗱 𝗶𝗺𝗽𝘂𝗹𝘀𝗲 𝘀𝗵𝗼𝘂𝗹𝗱 𝗮𝗰𝗰𝗲𝗹𝗲𝗿𝗮𝘁𝗲 as price advances back into the wedge toward its upper boundary.
🎯 𝗧𝗵𝗲 𝗵𝗶𝗴𝗵𝗲𝗿 𝗿𝗶𝗴𝗵𝘁 𝘀𝗵𝗼𝘂𝗹𝗱𝗲𝗿, 𝗰𝗼𝗺𝗯𝗶𝗻𝗲𝗱 𝘄𝗶𝘁𝗵 𝗴𝗲𝗼𝗺𝗲𝘁𝗿𝗶𝗰 𝘀𝘂𝗽𝗽𝗼𝗿𝘁, 𝘀𝘂𝗴𝗴𝗲𝘀𝘁𝘀 𝘁𝗵𝗲 𝗰𝗼𝗿𝗿𝗲𝗰𝘁𝗶𝘃𝗲 𝗯𝗼𝘁𝘁𝗼𝗺 𝗶𝘀 𝗮𝗹𝗿𝗲𝗮𝗱𝘆 𝗶𝗻.
The geometry is speaking. The next impulse could be substantial. See wedge for future price targets.
$FXI $KWEB $PGJ $EWH $YINN $YANG $BABA $PDD $BABX $CQQQ $TME $NIO @HAOHONG_CFA

₿ $BTC BITCOIN — THE POWER OF THREE. 11/01/26
Three Lines. One Date. One Confluence.
There is something extraordinary about the geometry unfolding in $BTC ahead of Election Day, November 3.
Three independent trendlines are converging at virtually the same point:
① Long-term ascending support — the foundation of the broader structure.
② Recent declining support — defining the latest corrective phase.
③ Descending resistance — the upper boundary pressing down on price.
🔺 All three converge at the RED DOT, precisely on Election Day. See the chart.
This is a rare geometric alignment, where three separate price structures meet at a potentially important calendar catalyst.
The power of THREE should not be underestimated.
Even more interesting, $BTC is already attempting to reverse from an absorption wick, suggesting buyers are defending the lower boundary.
⚠️ A word of caution: Exhaustion is only around Sell 1–2 level, and volume remains unremarkable. This may not be an explosive event. The reversal could develop gradually absent a huge catalyst leading into the midterms.
Nevertheless, the geometry favors an UPWARD directional impulse from the confluence point, provided support holds.
Election Day may serve as the catalyst, but the geometry is already broadcasting the message.
Three lines. One intersection. A potential turning point.
Important level higher: $81k.
Share & Subscribe, <link in bio>.
$SPY $QQQ $IWM $MDY $RUT $DIA $SDOW $SOXX $SOXS $SMH $NVDA $TSLA $YINN $VIX $VXX $TLT $BTC $GLD $SLV $SVXY $DRAM $SNDK $MU $EWJ $EWY $SOL $ETHA $IBIT $SBIT
Astro Zan retweeted
$SOXL: Has the Price Capitulated? 10/31/26
My Take: YES! The Geometry and Net Volume Suggest Capitulation. ✅
🔹 Two Corrective Waves: The initial decline followed a remarkably linear, methodical ~30° descending path, interrupted by a deceptive rally into resistance before the second, far more aggressive ~60° nosedive.
🔹 Follow the Geometry: See the yellow marks identifying the original corrective path and the blue marks highlighting the accelerated selloff. Both waves converged near the same descending support structure. Almost too geometrically precise for a supposedly free market! 😉
🔹 Capitulation Signal: Near Friday's close, net volume reached an extreme negative reading before reversing aggressively. See the yellow marks and green arrow in the upper chart. This is characteristic of selling exhaustion and potential capitulation.
🔹 The Price Response: $SOXL rebounded sharply from low $70's to the $77–$78 area, a powerful quick $7–$8 recovery from the lows.
🔹 What About My $63 Target? My earlier daily-chart projection called for a possible decline toward $63 on Monday. However, Friday's capitulation evidence materially changes that outlook. The low $70s may have already marked the corrective bottom.
🔹 Monday's Setup: Traders waiting for another opportunity in the low $70s may be disappointed. A gap higher on Monday is now a credible possibility, potentially leaving Friday's capitulation lows behind.
Bottom Line: Two corrective angles, one remarkably precise geometric support structure, and an aggressive reversal in net volume. See picture.
The evidence favors capitulation having already occurred. Confirmation comes with sustained upside follow-through from Monday, and mind the large gap overhead, ready for a surprise midterms elections outcome. #Taco will deliver?
Share & Subscribe, <link in bio>.
$SPY $QQQ $IWM $MDY $RUT $DIA $SDOW $SOXX $SOXS $SMH $NVDA $TSLA $YINN $VIX $VXX $TLT $BTC $GLD $SLV $SVXY $DRAM $SNDK $MU $EWJ $EWY

$SOXL: Has the Price Capitulated? 10/31/26
My Take: YES! The Geometry and Net Volume Suggest Capitulation. ✅
🔹 Two Corrective Waves: The initial decline followed a remarkably linear, methodical ~30° descending path, interrupted by a deceptive rally into resistance before the second, far more aggressive ~60° nosedive.
🔹 Follow the Geometry: See the yellow marks identifying the original corrective path and the blue marks highlighting the accelerated selloff. Both waves converged near the same descending support structure. Almost too geometrically precise for a supposedly free market! 😉
🔹 Capitulation Signal: Near Friday's close, net volume reached an extreme negative reading before reversing aggressively. See the yellow marks and green arrow in the upper chart. This is characteristic of selling exhaustion and potential capitulation.
🔹 The Price Response: $SOXL rebounded sharply from low $70's to the $77–$78 area, a powerful quick $7–$8 recovery from the lows.
🔹 What About My $63 Target? My earlier daily-chart projection called for a possible decline toward $63 on Monday. However, Friday's capitulation evidence materially changes that outlook. The low $70s may have already marked the corrective bottom.
🔹 Monday's Setup: Traders waiting for another opportunity in the low $70s may be disappointed. A gap higher on Monday is now a credible possibility, potentially leaving Friday's capitulation lows behind.
Bottom Line: Two corrective angles, one remarkably precise geometric support structure, and an aggressive reversal in net volume. See picture.
The evidence favors capitulation having already occurred. Confirmation comes with sustained upside follow-through from Monday, and mind the large gap overhead, ready for a surprise midterms elections outcome. #Taco will deliver?
Share & Subscribe, <link in bio>.
$SPY $QQQ $IWM $MDY $RUT $DIA $SDOW $SOXX $SOXS $SMH $NVDA $TSLA $YINN $VIX $VXX $TLT $BTC $GLD $SLV $SVXY $DRAM $SNDK $MU $EWJ $EWY