Investor & Entrepreneur | U.S. Equities • AI • Crypto • Macro | Long-term thinking. Disciplined capital. Global perspective. | Building wealth, creating freedom
New York, USA
Joined April 2016
- Tweets15.7K
- Following2.6K
- Followers3.8K
- Likes28.4K





I'm watching $NBIS closely after its recent selloff and early signs of stabilization.
The chart shows a major decline from the $299.86 peak to the $83.53 historical low. At $110.93, the stock is attempting to build a base, but the moving averages still point to significant overhead resistance.
Key levels I'm watching:
Support: $105–$110
Breakout zone: $115–$120
First upside target: $130–$140
Major resistance: Around $160–$165
A breakout without volume confirmation could easily turn into another failed recovery. I'd rather see buyers demonstrate conviction before expecting a sustained move higher.
#NBIS #StockTrading #TechnicalAnalysis #AIStocks #NASDAQ

290
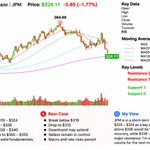
JPMorgan Chase ($JPM) is facing some short-term pressure after pulling back from its recent high of $364.68.
The chart snapshot shows a close at $324.11, down 1.77%, with trading volume reaching 6.78 million shares. Price is now below the 5-day, 20-day, 50-day, and 120-day moving averages, all clustered around $336–$339.
The $320–$324 area is the key support zone to watch. A sustained recovery above $336 could be the first sign that buyers are regaining control.
I’m watching how JPM reacts around support before drawing conclusions about its next major move. The banking sector still deserves close attention.
#JPM #JPMorgan #BankingStocks #StockMarket #TechnicalAnalysis #WallStreet

47
Robinhood is under significant technical pressure. The chart snapshot shows HOOD at $68.53, down 0.95%, with trading volume of approximately 4.19 million shares.
The stock remains below every major moving average:
MA5: $73.80
MA20: $84.08
MA50: $100.36
MA120: $100.45
MA250: $96.15
The technical structure remains bearish, with $67–$68 as the immediate support zone and $63.50 as the key historical downside level. On the upside, reclaiming $73–$74 would be the first sign of improving momentum, while $84 is the next major resistance.
There is also a new competitive development worth watching: Kalshi plans to expand into stock and ETF trading, potentially increasing competition for Robinhood's brokerage and prediction-market businesses.
I believe Robinhood still has long-term potential in retail investing and prediction markets, but the chart needs confirmation before calling this a recovery. I'm watching support, volume, and a sustained move back above the short-term moving averages.
#HOOD #Robinhood #Fintech #StockMarket #Trading #PredictionMarkets #TechnicalAnalysis

1
62
Google's technical setup is at an important turning point. Shares have pulled back sharply from the $403.96 chart high and are now trading near the $277.60 chart snapshot close.
The moving averages tell an important story:
MA5: $287.47
MA20: $295.00
MA50: $322.87
MA120: $338.57
MA250: $332.25
Price is below every major moving average, which keeps the broader technical picture bearish. A sustained move above $300 would be the first meaningful improvement, while $322 remains a bigger hurdle.
I believe patience is key here. The next move needs to be supported by stronger buying volume, not just a short-lived bounce.
#GOOG #Alphabet #GoogleStock #MovingAverages #TechStocks #Trading

AMZN — Volume Is Telling an Important Story.
Amazon's latest chart session closed at $257.75, down 3.34%, with approximately 47.87 million shares traded and $12.407 billion in turnover.
Volume activity was above the displayed five-day average indicator, suggesting increased participation during the pullback. That's something I wouldn't ignore.
The stock is now trading near its short- and intermediate-term moving averages. Holding the $254–$257 area could help establish a base, while a break below $254 may expose the $250–$253 zone.
I believe the next meaningful signal will come from how price and volume behave together. A strong recovery needs more than a green candle.
#AMZN #AmazonStock #Trading #VolumeAnalysis #TechnicalAnalysis #WallStreet

85
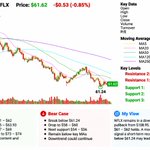
NFLX is approaching a critical technical level.
Netflix was trading around $62.21 on Monday, up 0.10% in early trading. The latest chart snapshot showed a close of $61.62, down 0.85%.
The technical structure remains weak. Shares are still below the MA5 at $62.85, MA20 at $63.93, and MA50 at $68.85.
I'm watching $61.24 as the immediate support reference. A move above $63.93 would be the first meaningful sign of short-term recovery, while $67–$69 remains the next major resistance zone.
A bounce is encouraging, but sustained buying volume is what will make the difference.
#NFLX #Netflix #StockMarket #TechnicalAnalysis #StreamingStocks #NASDAQ

83
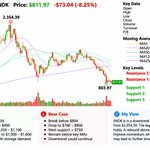
A sharp selloff doesn't automatically create a buying opportunity.
SNDK has pulled back dramatically from its $2,354.39 chart high and recently tested the $803.97 area. The latest session's heavy decline shows that sellers still have meaningful control.
For momentum to improve, I want to see the stock reclaim $850 first, followed by a sustained move above $900. Until then, any bounce could simply be a short-term recovery inside a larger downtrend.
Patience and confirmation matter more than chasing a green candle.
#SNDK #Trading #PriceAction #TechnicalAnalysis #WallStreet #SemiconductorStocks

DELL Technologies ($DELL) is facing a major technical test after a sharp pullback from its $594.69 peak.
The chart shows a close at $344.53, down 7.18% in the displayed session. Price is trading below the 5-day MA at $354.01 and the 20-day MA at $413.17, signaling that short-term momentum remains under pressure.
The $330–$335 zone is the first area I’m watching for support. A recovery above $355 would be an important first step toward stabilizing the chart.
I still see long-term potential in AI infrastructure, but the technical picture needs to improve before I become more constructive.
#DELL #AIInfrastructure #AIStocks #DataCenters #StockMarket #TechnicalAnalysis

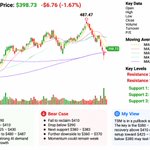
TSM is at an important technical crossroads.
Here are the levels I'm watching:
Support 1: $380–$383
Support 2: $360–$370
Major downside zone: $350–$355
Resistance 1: $400–$410
Resistance 2: $425–$430
Major resistance: $480–$487
The stock is trading below its short-term and medium-term moving averages in the chart snapshot. That tells me buyers still have work to do.
A sustained move above $410 would improve the short-term setup. A decisive break below $380 would increase downside risk.
#TSM #TechnicalAnalysis #TradingLevels #StockTrading #SemiconductorStocks

61
AMZN: Can Amazon Challenge $280 Again?
Amazon's recovery from the $230 area has brought the stock back into an important trading range.
The technical levels are becoming clearer:
Support: $257–260
Major support: $253–255
First resistance: $267–270
Upside target: $275–280
Major resistance: $287–290
With the price still holding above its key intermediate moving averages, the recovery case remains worth watching.
Personally, I would like to see AMZN reclaim $270 first. A sustained move above that level could put $280 back on the radar.
#AMZN #Amazon #PriceAction #StockMarket #TechnicalLevels #NASDAQ

103
Key Levels to Watch
INTC has several important technical levels worth watching:
Support: $59–$60
Secondary support: $53–$55
Major historical support: $40–$43
Resistance: $62–$63
Next upside zone: $65–$70
Major recovery hurdle: $75–$78
The stock is showing early signs of stabilization, but the broader moving-average structure remains bearish.
I would rather see a confirmed breakout than chase a short-term bounce. Discipline matters, especially after a correction of this magnitude.
#INTC #IntelStock #StockTrading #TechnicalLevels #NASDAQ

102
$AMZN is setting up an interesting technical picture.
Here are the levels I'm watching:
$270–$271: Immediate resistance
$275–$280: Next upside target zone
$287.20: Major previous high
$265–$266: First short-term support
$256–$257: MA20 support
$250–$253: Major moving-average support
$240–$243: Longer-term support zone
Holding above $265 would help maintain the short-term bullish structure. A decisive break above $271 could strengthen the case for another move higher.
The key is to follow price confirmation rather than assume the next direction.
#AMZN #AmazonStock #TechnicalAnalysis #SupportAndResistance #TradingStrategy

120
$TSLA is showing signs of a technical recovery after rebounding from the $297.38 low.
The November 11 session closed at $390.84, up 2.91%, with an intraday high of $395.43. Price has moved back above several key moving averages, including the MA20 near $381.84.
The next major test is the $395–$400 resistance zone. A convincing breakout with stronger volume could open the door toward $410 and $420.
I’m watching whether buyers can turn this rebound into a sustained trend rather than another short-lived bounce.
#TSLA #Tesla #StockMarket #TechnicalAnalysis #Trading

97
$RKLB is approaching an important technical decision point.
The rebound from $43.89 has brought the stock back above several short-term moving averages, and the latest chart shows a 6.54% gain on roughly 32.12M shares traded.
My focus is on three levels:
$60–$62: Support to defend.
$65–$67: Breakout confirmation zone.
$70–$73: Next upside target.
I like the improving momentum, but I want confirmation through price and volume before treating this as a sustained reversal. Rocket Lab is a stock worth keeping on the radar.
#RKLB #RocketLab #StockMarket #TechnicalAnalysis #SpaceStocks #TradingStrategy

1
122
$AAPL — The next move depends on how price reacts around key technical levels.
Resistance:
$352–$355
$358–$360
$365–$370
Support:
$343–$345
$335–$337
$320–$322
Apple is currently trading above its major moving averages, but the recent price action near resistance deserves attention.
Personally, I'd rather see a confirmed breakout above $355 than chase an unconfirmed move. A healthy retest of support could also create a better risk/reward setup.
#AAPL #Apple #TechnicalTrading #SupportAndResistance #StockTrading #NASDAQ

AMZN is approaching an important technical breakout zone.
Here's what I'm watching:
Current price: $267.95
Resistance 1: $275–$276
Resistance 2: $280–$285
Major resistance: $287.20
Support 1: $260–$262
Support 2: $253–$255
The stock is trading above its MA5 ($260.83), MA20 ($254.70), MA50 ($253.98), and MA120 ($253.07).
The technical picture is improving. I want to see buyers push through $275.31 with stronger volume before treating this as a confirmed breakout.
#AMZN #TechnicalAnalysis #Trading #NASDAQ #WallStreet

Microsoft is showing resilience, but the latest price action still deserves attention.
$MSFT was quoted around $541.36, up 2.03%, while the chart snapshot showed a close near $530.61 after a 0.99% decline. The difference highlights why tracking the actual market feed matters.
Technically, the $530 area is an important short-term battleground. Holding this zone could help stabilize momentum, while a move back above $541 would strengthen the recovery setup.
I'm watching whether buyers can turn this rebound into sustained upside rather than another short-lived bounce.
$MSFT $NVDA $AAPL #Microsoft #AI #TechStocks #StockMarket

$TSLA took a serious hit, closing at $343.69, down 10.77% in the latest session. Trading volume surged to nearly 79.7 million shares, signaling heavy selling pressure.
The stock is now trading below its 5, 20, 50, and 120-day moving averages. The $338–$340 zone is the first major support to watch. A break below it could expose $328–$332.
I want to see buyers defend support before calling this a dip-buying opportunity. Strong companies can still have difficult charts.
#TSLA #Tesla #StockMarket #TechnicalAnalysis #EVStocks