

🇦🇺 in 🏴 | Data Analyst and Visualisation | Tableau Fanatic | Tableau 2x #VOTD | #TableauNext '23
- Tweets228
- Following319
- Followers487
- Likes898






ALT Tableau dataviz focusing on Female Nobel Prize Laureates. Viz shows a timeline with Female winners shown by a large purple circle and non-female winners shown as a small grey dot. Female winners are a rare occurrence before 1975 but then showed an increase in frequency after 1975. A cumulative winners graph shows that only 6.2% of Nobel Prize laureates have been Female. Percentage breakdown by Nobel Prize category also shows similar small percentages, the highest of which is 14.3% in the category of Literature.

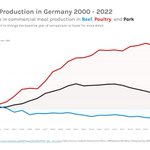
ALT Changes in commercial meat production of Beef, Poultry, and Pork in Germany. Since 2000, Poultry has shown the biggest change increase of over 100%, Pork has increased by around 15%, and Beef has decreased by just over -20%. All three meat types' production has decreased from 2021 to 2022.

ALT Tableau Data Viz of Crowd Attendance at Australian Open 1987 - 2023. Bouncing Back: Spectator attendance at Melbourne’s world-renowned Australian Open tennis tournament recovers after impacts of Covid-19. ‘The most locked-down city in the world’ this year saw crowds return to Melbourne Park with no restrictions on capacities for the first time in three years. The connected dot plot shows a steady increase in attendance from 1987 - 2020. 2021, and 2022 have dramatically decreased attendance while 2023 shows attendance has recovered to be on trend with pre-pandemic years. Attendance in 2023 was 839192 people.

ALT Tableau data viz showing data on unpaid work done per day by men and women. A bar chart is shown graphing the time spent by women divided by the time spent by men. Japan tops the bar chart where women spend 5.5 times more time doing unpaid work than men. A reference line representing an equal amount of time spent by men and women is drawn; all the counties in the data set surpass this line. An average reference line is drawn at 1.9 times more; on average around the world, women spend close to two times more time doing unpaid work per day compared to men.

ALT Mobile Tableau Data Viz showing overview dashboard for Public Sector Emergency Calls

ALT Three desktop layout Tableau dashboards for Public Sector Emergency Calls

ALT Tableau data viz showing the United Nations Human Development Index (HDI) from 1990 to 2021. The main graph is a spaghetti line graph with the world average highlighted in black and Australia highlighted in blue. The world average HDI is shown steadily increasing apart from years 2020 and 2021 where the HDI falls. Australia's HDI is above the world average and steadily increases since 1990. Below the HDI graph are shown spaghetti line graphs of the 4 indicators used to calculate the HDI; expected years of schooling, mean years of schooling, life expectancy at birth, and gross national income. The world average is shown to steadily increase in all except for life expectancy at birth where there is a slight decline since 2020. Australia also sees a trend of lying above the world average and increasing over time in the 4 indicators.

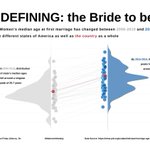
ALT Redefining: the Bride to be... How Women’s median age at first marriage has changed between 2006-2010 and 2015-2019 in the different states of America as well as the country as a whole. The Tableau data viz shows a dot and violin plot showing that across the board for states and the country average, ages for women at first marriage have increased over time. In 2006-2010 the distribution of ages fell around a singular peak of 25.7 years. By 2015-2019, three different peaks have emerged around 28.9 years, 27.8 years, and 26.7 years.


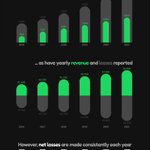
ALT Tableau data viz showing Spotify's growing consumer base and profit margins. Despite a growing consumer base, Spotify has never recorded a profit. The first graph shows a rounded bar chart showing that both total user and paying subscriber numbers are growing for Spotify. The second graph shows a diverging rounded bar chart with increasing revenues and losses made each year. The third graph shows that consistent losses are made each year, the highest of which was in 2017 with a loss of €1.23 Billion.

ALT Tableau data viz showing a spectrum of all Netflix titles sorted by decade and coloured according to IMDB score (low score = blue, up to high score = red). Filtering symbols mimic Netflix profile icons.


ALT Tableau Dashboard showing how "Everest Group" has been performing in attrition over the last 14 months. The dashboard has KPI's up the top showing 9 people left last month, 18 people leave on average each month, the average time spent at the company is 5.1 years, and average satisfaction is 2.5/4. Below KPIs is a attrition trend over the time range showing a large peak in April 22 but then returning to normal level just one month later. The bottom section of the dashboard takes a detailed look at the metrics of the leavers, who they were, when they left, where they worked, what they faced while at work, and why they left.