

Investing in the world’s most undervalued companies. Limited to 100 LPs. Currently open to accredited investors.
Joined October 2022
- Tweets135
- Following0
- Followers2.8K
- Likes1.2K



Pinned Tweet
Bilbel Capital’s 2026 Semi-Annual Letter is out!
Returns since inception (February 2022):
Bilbel Capital Gross: 1,748.3%
Bilbel Capital Net: 847.1%
S&P 500: 74.3%
bilbelcapital.com/

Joel Greenblatt wanted a simple way to earn high returns.
He created the magic formula. It focuses on 2 factors:
-Return on Capital (ROC): Measures how well a business uses its assets to make money.
-Earnings Yield (EY): Shows how cheap a stock is compared to its earnings.
How It Works:
1. Rate 3,500 of the largest companies based on their Return on Capital (best to worst).
2. Rate the same companies by their Earnings Yield (high to low).
3. Add the two scores.
The lower the combined score, the better the ranking.
Example:
-A company ranked #1 in ROC and #5 in EY gets a combined score of 6 (1 + 5).
-A company ranked #10 in ROC and #4 in EY gets a score of 14 (10 + 4).
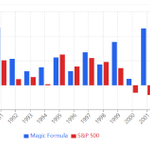
Average returns per year over the 17 year period:
-S&P 500: 12.4%
-Magic Formula: 30.8%


Donald Keim studied NYSE and AMEX companies from 1951 to 1986.
What he did:
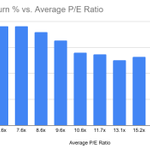
-He looked at how P/E ratio, company size, and returns are related.
-Each year, companies were put into ten groups by their P/E ratio.
Results:
-The cheapest stocks were found in the smallest companies.
-The cheapest companies did much better than the expensive companies.


3
553
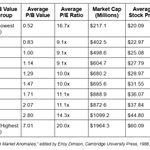
Donald Keim studied NYSE companies from 1964 to 1982.
He looked at how price-to-book (P/B) value, price-to-earnings (P/E) ratio, market size, and stock price are related.
Lower price-to-book value stocks were associated with lower P/E ratios, smaller market capitalizations, and lower average stock prices.

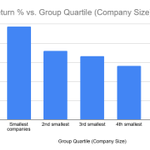
T. Nakamura and N. Terada sorted Japanese stocks by size and tracked their returns from 1966 to 1983.
$1 million invested from 1966 to 1983 in the:
-Largest companies would have grown to $14.01 million.
-Smallest companies would have grown to $82.14 million.


1
2
648
Market feedback on a decision can take years. Patterns only help when the thing creating them does not change.
The only reliable way to learn is to create a system, an internal feedback loop.
It is most useful when it:
- Maximises the error corrected per iteration
- Minimises the time per iteration
This maximises the rate at which reliable knowledge is created.
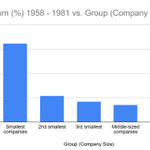
4 researchers studied Australian stocks from 1958 to 1981.
They ranked all industrial, mining, and oil companies by size and tracked their returns.
$1 million invested from 1958 to 1981 in the:
-Largest companies would have grown to $18.03 million.
-Smallest companies would have grown to $30.78 Billion.
The smallest companies generated extraordinary returns over this period.


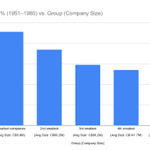
3 researchers studied Canadian stocks from 1951 to 1980.
They ranked 391 companies by size and tracked their returns.
$1 million invested from 1951 to 1980 in the:
-Largest companies would have grown to $18.12 million.
-Smallest companies would have grown to $158.35 million.


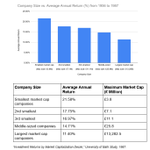
Mario Levis and John Moxon studied UK stocks for 31 years (from 1956 to 1987). They ranked companies by size and tracked their returns.
$1 million invested from 1956 to 1987 in the:
-Largest companies would have grown to $7.92 million.
-Smallest companies would have grown to $20.35 million.

John R. Chisholm looked at stocks in the UK, France, Germany, and Japan for 15 years (from 1974 to 1989).
He grouped them by market capitalization from smallest to largest and tracked their returns.
Results:
Over the 15 years, smaller companies had higher annual returns compared to larger companies in all four countries.

We keep each thesis as short as our best set of explanations allows.
This maximises the speed at which we iterate on it.
"People mask their incompetence through complexity.
Investing is like a mystery treasure hunt. There are many factors of different importance in solving the mystery.
We see and hear so many things every day. Our mind tries to make sense of all these things, but we don't always understand everything.
If we don't understand something well enough, we keep thinking about it over and over.
Although there is a lot of noise around us, the loudest noise is our own thoughts.
When we focus on understanding something, it's like the fog on glasses clearing up. As it clears, we can finish up seeing things simply.
What can be simpler than seeing reality as it is?
You need a book to explain an unsolved mystery, but only a sentence to explain a solved one."
~ Bilbel Capital Annual Letter, 2023
Tweedy, Browne looked at 1,000’s of stocks. Tracked over many, many years. After over 100,000 stocks, they found out that most top stocks shared at least one of these traits:
-Low price compared to earnings.
-Low price compared to book value.
-Low price relative to cash flow.
-High dividend yields.
-Lower current earnings compared to past levels (especially if priced below book value)
-A stock price that has dropped a lot from previous highs.
-Small size (market capitalization).
-Company leaders or the company itself are buying more stock
In many cases, the clues were there.
Each of these traits was like a small piece of a puzzle. Good enough to give a sign, but not good enough to make a good decision.
But, when put together, they showed a clear picture:
An undervalued stock.
Not so much because patterns repeat. But because the underlying causes have not changed.
Marc Reinganum looked at all American stocks from 1963 to 1980.
He grouped them from smallest to largest and tracked their returns.
$1 million in the smallest companies in 1963, it would have grown to $46.28 million by 1980.


Bilbel Capital retweeted

Believe it or not, some great companies trade at negative EV.
You rarely see them posted publicly. Because when smart investors notice, they can quickly reprice.
@bilbelcapital finds them first. Today, the portfolio is full of good businesses at negative EV or 2-4x earnings.

I have decided that unless the quality of the company warrants it I am only going to writeup negative EV companies. Subscribe if this interests you, the best of the negative EV opportunities will be for paid subscribers only, one such coming this week. It will also never be cheaper to be a paid subscriber. Bochman examined 2,613 U.S. companies that traded at negative EV between 1972 and 2012 and found an average 50.4% one-year forward return across 26,569 stock-month observations. The one year base rate of what I am doing is 50.4%, I think your paid subscription will be worth it. Substack in bio.
Source:
blogs.cfainstitute.org/insid…
Bilbel Capital retweeted

simplicity has 2 functions:
- Reducing starting error.
There are fewer assumptions, moving parts, and relationships that can be wrong.
- Increasing speed of error correction.
A simpler understanding makes errors easier to find and correct. This lets us go through more cycles of error correction in the same amount of time.
The best minds of all time Munger, Einstein preach simplicity. Simplicity comes from deep knowledge and understanding. The best businesses ever took a simple idea seriously $COST $AMZN $WMT
@sammutgabi
Smaller Stocks, Bigger Returns
Rolf Banz studied NYSE stocks from 1926 to 1980.
What he did:
-Grouped companies by size, from the largest to the smallest, based on their market capitalization
-Then, he checked how much money people made from investing in these groups over time.
$1 million in the smallest companies in 1926, it would have grown to $524 million by 1980.


Stocks That Did the Worst in the U.K.
Three researchers studied how well the worst and best stocks in the U.K. performed over time.
What they did:
-They looked at 30 of the worst and 30 of the best stocks from 1973 to 1982, using a list of the top 200 companies.
-They checked these stocks over the time periods:
What they found:
The previously worst-performing stocks had the best returns in the last time period, earning 30.84% per year on average from 1983 to 1987.

Stocks That Have Dropped in Price
Two professors looked at NYSE stocks from 1932 to 1977 to see how past performance affects future returns.
What they found:
-Stocks that had dropped a lot in the past 5 years did much better later. Up 18% above the market in 17 months.
-Stocks that had done well in the past 5 years did worse later. Down 6% below the market in 17 months.
They also saw this pattern with stocks over 3 years.


Companies That Buy Their Own Stock
Fortune Magazine studied companies that bought back their own stock. They looked at 1,660 companies from 1974 to 1983.
When companies buy back shares for less than their value, it makes each share more valuable.


Canada: What Happens When Insiders Buy Stocks
2 researchers looked at Canadian stocks to see how well they did when company insiders bought shares. They studied 111 big companies on the Toronto Stock Exchange from 1968 to 1972.
They checked:
-403 stock trades made by insiders who were also directors at Canadian banks, and
-580 trades by insiders who were not directors at banks.
What they found:
-Insiders who worked at Canadian banks made 7.8% more money per year than the market.
-Insiders who did not work at banks made 3.8% more money per year than the market.
The study did not focus on cases where many insiders bought large amounts of shares, but it still showed that insider buying was often an interesting signal.

