

Crypto is macro (TA and more), Free opinions, NFA.
Joined April 2025
- Tweets10K
- Following205
- Followers2.8K
- Likes17.4K





Pinned Tweet
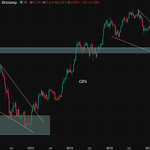
$BTC had to break the april 2025 low and trap 'everyone' into the 4yc narrative (that's what irregular corrections do up & down)
I posted this scenario on dec 4 last year, receipt👇
This was a correction inside a longer cycle and we're now moving towards the end of it

#Bitcoin wave 5 down of C is coming imo
If it plays out sentiment goes 6feet < ground
Bears celebrate as april low breaks & short a fake Bup like hungry rats
Only to get trapped in a bigger structure (1,2 of 3) they did not see coming
invalidation > 99k (bears f!cked anyways)

$BTC
2023 FW break out + retest* in wave4
2026 FW break out + retest* in wave2
*leverage cleansing
As long as the july low stands this impulse count remains valid. If it breaks we reassess
NOBODY KNOWS the future but wave2 can be very scary and retrace 99.9% of wave1

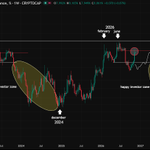
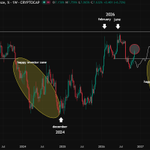
$BTC 2023 vs 2026 wave1 PA
Big Green up
6 corrective weeks (2023 irregular vs 2026 straight down)
22% down from local top (so far for 2026)
It was a wave4 in 2023, and still could be so in 2026 as long as top of wave1 isn't tagged
Striking Resemblance


1
15
614
$USDT.D tells us this scenario happened before
Velocity/sharpness of the move is slightly different yet direction/structure remain the same : 1st move down from the top + correction up toward the breaking point
The past doesn't guarantee the future but so far so good

Stablecoin Dominance
Some ppl say this time is different. No it's not (hard not to see the similarities👇)
Until $BTC wave 1/1 is tagged all this noise could still be 4/1 - respect the data!
Remember it's all probabilities, we assess the situation as it comes
So far so good

"The question is whether the market is finally moving past forced selling and beginning to look forward again"
Must watch 👇

The market was hit with a barrage of bad news this week.
Jensen Huang ousted. The Fed raises the possibility of a 50bp hike in December. The largest weekly rise in 2-year Treasury yields since 2022. More liquidity headwinds.
And yet, SMH rallied 4.5%, credit markets strengthened, and risk appetite improved.
In this week's video, I explain why the market's reaction to bad news is a good sign. I go through the signals that suggest the deleveraging has run its course.
Taiwan, China and Korea intervening to stabilize their markets, and why governments increasingly recognize that AI's future depends on healthy capital markets.
I also revisit the most important lesson from the iPhone era: technological inevitability doesn't eliminate corrections, but corrections don't eliminate technological inevitability.
AI is inevitable. Tokenization is inevitable.
The question is whether the market is finally moving past forced selling and beginning to look forward again.
Watch here: youtu.be/EE7KAo0XOuI

The Individual Crypto Investor🤘 retweeted

Liquidations 24hr: $1.93b
Longs : $1.8b
Shorts : $128m
316591 traders liquidated @SenLummis


Top of wave1 tagged = current PA is a wave2 (these can retrace the entire wave1)
63-65K cushion becomes more likely now
Let's see what happens 🤝
$BTC 2023 vs 2026 wave1 PA
Big Green up
6 corrective weeks (2023 irregular vs 2026 straight down)
22% down from local top (so far for 2026)
It was a wave4 in 2023, and still could be so in 2026 as long as top of wave1 isn't tagged
Striking Resemblance
$BTC 2023 vs 2026 wave1 PA
Big Green up
6 corrective weeks (2023 irregular vs 2026 straight down)
22% down from local top (so far for 2026)
It was a wave4 in 2023, and still could be so in 2026 as long as top of wave1 isn't tagged
Striking Resemblance
Stablecoin Dominance
Some ppl say this time is different. No it's not (hard not to see the similarities👇)
Until $BTC wave 1/1 is tagged all this noise could still be 4/1 - respect the data!
Remember it's all probabilities, we assess the situation as it comes
So far so good
Stablecoin Dominance works in inverted correlation with $BTC
Unfollow anyone still talking abt bear mkt : they have NO clue how corrective/impulsive HTF structure works
If you're not allocated yet, wait for the depth of wave 2 correction = when CT turns ultra bearish again🤝

Aside from my lecture of PA and understanding of structure, CK's indicators are the only ones i am paying attention to.
Only they flashed the market top back in dec24/jan25 !

The crypto breadth waves called the local top like a boss didn't it flashing red. It is one of the reasons why I was expecting a pullback in October.
Sorry I didnt see such a deep pullback for $BTC, and I'm sincerely sorry it's extended into November which is where I did think we would see a bounce for #BITCOIN.
The waves indicator is almost at the green buy zone as BTC pulls back after a 5 wave move up.
I'll keep you updated, you can view this indicator in our #supercharts on our website.
STAY TUNED


The Individual Crypto Investor🤘 retweeted
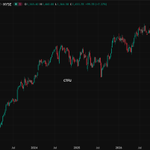
$BTC 6yrs of PA climbing up the stairs in fear or disbelief
We are 1800% above the covid low = Buy when it's the end of the world !
The next significant mark up is near⏳


READ AGAIN 👇
$BTC D vs M
The Move started in july retraced almost 50% so it could be it BUT,
a Wave 2 could go down till the start of wave 1
a Wave 4 has space to fall near the top of wave 1
We could also see a B up + C down (invalidation 87.4K)
It could still last weeks
NOBODY KNOWS⏳

