climate.us (@climateUS_) header
climate.us (@climateUS_) profile picture

An independent, nonprofit successor to Climate(.)gov, safeguarding public access to trusted climate data, tools, and information.

Joined July 2025
Photo by climate.us (@climateUS_)Photo by climate.us (@climateUS_)Photo by climate.us (@climateUS_)Photo by climate.us (@climateUS_)Photo by climate.us (@climateUS_)Photo by climate.us (@climateUS_)Photo by climate.us (@climateUS_)Photo by climate.us (@climateUS_)Photo by climate.us (@climateUS_)Photo by climate.us (@climateUS_)
climate.us retweeted
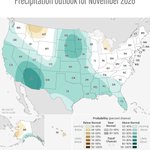
Not a whole lot of unusual cold to be found across North America into mid-November. An El Niño-fueled area of low pressure near Alaska's Aleutian Islands will continuously flood the continent with mild, Pacific air.
13
46
5
278
44,318
Without #ClimateChange, flood peaks in Europe from Storm Boris would have been as much as 22% lower, new models suggest. scim.ag/4e0DIKw
1
2
1
12
1,560
New publication: Changes in temperature, rainfall and snow cover during the reproductive season of #Arctic-breeding #birds, by @_hanslinssen @BartNolet and others. #climatechange #migratorybirds doi.org/10.1007/s00484-026-0…
1
1
140
The 2026 #EmissionsGap Report launches today. Where are global emissions heading, and what will it take to change course? Join UNEP and @ODI_Global as we unpack the latest findings and the action needed to close the gap. Watch live: youtube.com/live/ZbGnvLq3dPg
6
30
60
9,200
New study shows: Lake Kariba’s basins respond differently to low water levels. Using a novel integrated approach combining satellite data, including data from ESA's Climate Change Initiative Lakes project, with a 3D model across 14 years, researchers found that 💧 the upstream basin is particularly sensitive and 💧 downstream waters are more stable Read the full study: agupubs.onlinelibrary.wiley.… Image: Greife, A. J., Calamita, E., Pinardi, M., Carrea, L., Maidment, R. I., Pitarch, J., et al. (2026). How water levels shape phytoplankton blooms across Lake Kariba, 2004–2018. The heatmaps compare weekly changes in algae growth across the reservoir’s three basins. Symbols mark years with low, medium and high water levels. The maps show where persistent bloom hotspots occurred most frequently under each water-level condition. Satellite datasets from the European Space Agency’s Climate Change Initiative underpin the analysis.

1
2
4
368
climate.us retweeted
Introducing TIME100 Climate 2025: The executives, researchers, and innovators working to help unlock the necessary funding and resources needed for successful and equitable climate action time.com/collections/time-10… Artwork by @Sunscribes
85
129
36
382
514,844
climate.us retweeted
The Trump administration has taken dozens of actions that all serve to undermine climate science in the US. But the economic justification doesn’t match up with the economic costs. Listen to the Big Take podcast for more trib.al/QPQwd5Y
3
1
1
5
17,934
Do you believe that climate facts should remain free from political interference and easily accessible? If so, watch our video and consider supporting our initiative. Find out how you can support: donorbox.org/climate-us-prot…
1
10
1
16
748
New podcast with @inevitablemcj where I discuss how climate science is under attack and why it matters now more than ever: mcj.vc/inevitable-podcast/dr…
20
2
30
3,951