

Crypto & Technical Analysis Not Financial Advice Telegram: https://xitter.cf/t.co/Rh7qaOjNfC
Japan
Joined November 2022
- Tweets10.3K
- Following131
- Followers3.5K
- Likes47




$NIL has been trading in a prolonged downtrend, characterized by consistent lower highs and significant selling pressure. The descending trendline connecting previous swing highs continues to act as a major dynamic resistance.
#NIL #Crypto
However, the price is currently consolidating below the descending trendline. This indicates that buyers are attempting to regain control while sellers continue to defend the broader bearish structure.
🟢 This coin monitoring line, Breakout from this Descending TrendLine, This will be a good Buy signal.
🎯 Short-term targets $0.115 - $0.165

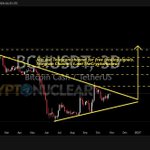
$BCH is forming a large symmetrical triangle pattern on the 3-day timeframe following a significant decline from its 2026 high near $669 toward a low around $181.
#BCH #Crypto
🟢 Wait and Buy/Long after the price successfully breaks the resistance line of this pattern.
🎯 Minimum short term targets $339 - $420


$XRP on the 3D timeframe, price is still trading below the Descending Trendline, which has formed through a series of lower highs since the peak around $3.66.
#XRP #Crypto
This descending trendline indicates that selling pressure continues to dominate the medium- to long-term price structure. Each attempt to move higher has the potential to encounter dynamic resistance, which could limit the upside and trigger renewed selling pressure.
🟢 For now, it's best to keep monitoring this coin. If there is a breakout from this descending trendline, this will be a good buy signal.
🎯 Short term target minimum +20% after Breakout.

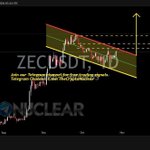
$ZEC has experienced a strong upward impulse, rallying from its previous consolidation area before entering a downward-sloping channel.
#ZEC #Crypto
This price structure resembles a Bull Flag, a bullish continuation pattern that typically forms after a strong upward move, followed by a temporary corrective phase.
🟢 Buy/Long after Breakout from this Bull flag.
🎯 Short term target minimum +25% to +50% after price successfully Breakout.


$HAEDAL ~ 3D 🟢 $HAEDALUSDT $Crypto
#HAEDALUSDT $USDT $USDC
#HAEDAL remains below the descending trendline that has been forming since the high around $0.30. The yellow trendline represents long-term bearish pressure, with the price consistently forming Lower Highs.
However, there is an interesting change in the price structure:
🟡 Price is beginning to form a base/accumulation area around $0.0141–$0.0185.
📈 After a prolonged decline, the price appears to be recovering from the low area and is once again approaching the descending trendline.
⚠️ The descending trendline remains the key resistance. As long as price has not broken and confirmed above it, the long-term trend should still be considered bearish.
🟢 It is better to wait until the price successfully breaks through this resistance line, and buy/go long after the price successfully breaks out.
🎯 Short term target minimum 15%+ after Breakout.
❗ Which coin should we analyze next? Let us know!


$WIN is currently testing a long-term *Descending Trendline* that has constrained price movements over the past several years.
#WIN #Crypto
After experiencing a significant decline from its historical highs, the price has begun to recover from its lowest levels and is now approaching the descending trendline, which represents a critical dynamic resistance.
If WIN manages to break above this trendline with strong momentum, it could signal the beginning of a potential market structure shift from bearish to bullish. However, confirmation of a valid breakout remains the key factor to watch.
🟢 Wait and Buy after the price successfully Breakout from this Descending TrendLine.
🎯 Short term target minimum +25% - +50% after the price successfully Breakout.

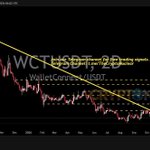
$WCT Still under pressure from the Descending TrendLine for now.
#WCT #Crypto
However, the chart shows a bullish trend trying to take control of the coin's price. Confirmation of a breakout from this descending trendline is needed to change the bearish structure to a bullish one.
🟢 Wait and Buy/Long after the price successfully Breakout from this Descending TrendLine.
🎯 Short term target minimum +20% after Breakout.

$ANIME So far it is still moving within this Descending TrendLine. #ANIME #Crypto
Sellers have continued to suppress the movement of this coin so far, but currently the price is starting to try to break out of this resistance line.
🟢 Long / Buy after the price successfully Breakout from this Descending TrendLine.
🎯 Short term target is minimum +25% after price successfully Breakout.


$INIT ~ 3D 🟢 $INITUSDT #Crypto
#INITUSDT $USDT #Crypto
#INIT 🟢 remains inside a clear long-term bearish structure, with price consistently forming lower highs and lower lows from the major peak around $1.44.
🟡 The descending yellow trendline has acted as dynamic resistance for an extended period, repeatedly limiting bullish recovery attempts.
🟢 A bullish scenario will form after the price successfully breaks through this resistance line.
🟢 It's best to pay attention and wait until the price successfully breaks through this resistance line, then open a long/buy position after that.
🎯 Short term target is at least 15%+ after that.
🔴 Any rejection of this resistance line, Will continue the Bearish trend.

$BTC is consolidating within a descending channel after a strong upward move, potentially forming a Bull Flag Pattern. Price is currently testing a key support zone around $80,000–$81,000, while resistance remains concentrated along the descending trendline. #BTC #Crypto
The structure suggests that Bitcoin may be preparing for another bullish continuation. However, confirmation is still needed before a potential breakout can be considered valid.
🟢 Wait and Buy/Long after Breakout from this Bull flag.
🎯 Short term target minimum $87,000 - $90,000

$DYM Currently, it is still trapped in the Descending TrendLine structure, but for now, it seems that Seller pressure is starting to weaken as seen in this Chart structure. #DYM #Crypto
🟢 If you still have confidence in this coin, Buy / Long gradually from here.
🎯 Short-term targets $0.0625 - 0.0345


$ALT The Descending TrendLine structure continues to suppress the price of this coin. This indicates that Bearish Pressure will continue to persist since 2024.
#ALT #Crypto
However, currently buyers/Bullish are trying to push the price of this Coin back up to break through this resistance line.
🟢 Buy/Long after the price successfully Breakout from this resistance line.
🎯 Short term target minimum +25%

$AR Still moving within the Descending TrendLine structure since early 2024 and currently Buyers are trying to Break through this Descending TrendLine structure.
#AR #Crypto
🟢 Breakout from this Descending TrendLine will be a very good Buy/Long signal for now.
🎯 Minimum short term targets $4.7 - $6.5


$DOGE is retesting a critical long-term support zone. After an extended decline from its previous highs, #DOGE has returned to a historical accumulation area that has acted as an important price base in the past. #Crypto
🟢 Buy or Long gradually from this support block.
🎯 Short term target is minimum +25% of this support.

$KERNEL remains in a downtrend, characterized by a series of lower highs and persistent selling pressure following its previous peak. #KERNEL #Crypto
However, price is now trading at relatively low levels following an extended decline. This creates the potential for a technical rebound if buying pressure increases and price manages to break through key resistance levels.
🟢 Wait and Buy/Long after the price successfully Breakout from this Descending TrendLine.
🎯 Short term target minimum +25% after price successfully Breakout.
