






Nick retweeted

🚨 New #dataviz for this week's #MakeoverMonday, featuring a sneak peek of @dataoutsider's new algorithm "Path-Swarm" with a "Super-Swarm" plot.
🔗: tabsoft.co/3XvGaRC
🛠️: built with the vizmath package (find it on PyPI!)
#python #DataFam #tableau

new #Medium blog with #python and #Tableau tips included :)
Introducing the Quad-Tile Chart & Squaremap: Squarify Your Data
medium.com/towards-data-scie…
#datavisualization #dataviz #datafam #tableaupublic

2 new #Medium blogs with #python and #Tableau tips included :)
Radial Treemaps:
towardsdatascience.com/radia…
Crystal Bar Charts:
towardsdatascience.com/intro…
#datavisualization #dataviz #datafam #tableaupublic

1
98
new #Medium blog on my Multi-Chord Diagram #dataviz
there are some #python and #Tableau tips included :)
medium.com/@nickgerend/intro…
#DataVisualization #datafam #tableaupublic

Nick retweeted
Hey #datafam, new blog up on #Medium! - Behind the Viz: Pet Search with Python and Tableau
Check it out to get started using @dataoutsider's vizmath #python package! A complete code and #Tableau build walkthrough.
medium.com/@xrayattack/behin…
#dataviz
Nick retweeted
🚨 New #dataviz on summer Olympic participation by country. 1 sheet!! #MapLayers
🔗: tabsoft.co/43JwLWL
🛠️: built with @dataoutsider's new vizmath package (find it on pypi!) Tutorials coming soon!
#Olympics #DataFam #tableau #python

new #dataviz and it's all ❤️ :)
public.tableau.com/app/profi…
#DataVisualization #DataFam #tableaupublic #Tableau

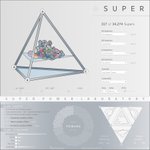
Super powers, quaternary diagrams, and more in a new #dataviz :)
public.tableau.com/app/profi…
#Datavisualization #DataFam #tableaupublic #Tableau

Nick retweeted
Hey #DataFam! Check out my new #dataviz on some basic attributes of cat breeds. I used the new bubble series algorithm in the @dataoutsider #python package to make this and it just happened to look like a fishbone. How fitting!
🔗tabsoft.co/3OWIPMH

My bubble series algorithm is now open source in the dataoutsider #python package!
Check out #PyPI for examples to make your own (#Tableau friendly) bubble series chart :)
pypi.org/project/dataoutside…
#dataviz #DataFam #tableaupublic


a #dataviz on interstate highways I did last year :)
🛣️
width = highway distance
# lanes = states traversed
oriented by start-point & heading
vertical/horizontal by < or > 45° heading
curvature = deviation from straight-line
ordered by year finished
#tableaupublic #datafam


I couldn't pass up another tallest buildings list on Wikipedia 🏙️
Here are the tallest residential buildings in a new viz :)
public.tableau.com/app/profi…
#dataviz #datafam #tableau #tableaupublic #uptown


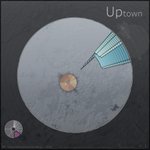
each window in a building represents each half decade the building existed in width and a span of 5 floors in height, the arc-fill connects a country's buildings 🌇
lots of tooltips/clickables/filters, here's New York City :)
data: en.wikipedia.org/wiki/List_o…

1
Like tall buildings? 🏙️
I do, and Wikipedia has a nice list of the 80 tallest!
Here they are in a new viz :)
public.tableau.com/app/profi…
#dataviz #datafam #tableau #tableaupublic #skyscraper
