

Retired psychologist, options trader. Zen trader $SPX Trader- gamma /options Greeks. Educational NOT ADVICE OXO2Q1 https://teapawt.org/t.co/kcrkdqrgmH
Coral Springs, FL
Joined January 2016
- Tweets18.2K
- Following426
- Followers9K
- Likes11.1K





Pinned Tweet
1/
📉 SPX hits a round number and just stops.
Grinds sideways. Chops you to ribbons.
Then out of nowhere it slices through and accelerates. Five points becomes ten. Ten becomes twenty.
None of that is random.
Here's what's actually moving the tape 🧵

SPX hits a round number and just stops. Grinds sideways. Chops you to ribbons. Then out of nowhere it slices through and runs 20 points like someone kicked a hornet's nest.
For years I thought that was random. It isn't.
It isn't the Fed. It isn't earnings. It isn't whatever the suit on TV is yelling about at 9:28.
The article names the actual force behind every one of those moves. Once you see it, you can't unsee it. 🌊
docmcgraw.substack.com/p/how…
GameStop. Retail piled into calls. Dealers sold those calls. Dealers were short gamma on the upside.
As GME ripped, dealer delta went up. To stay neutral they bought more shares. That buying accelerated the squeeze. More buying, higher delta, more buying.
Most traders still think negative gamma only runs on the put side. That assumption is exactly what gets them hurt.
The article explains where the acceleration actually comes from — and it isn't where most people think. 🧭
docmcgraw.substack.com/p/whe…
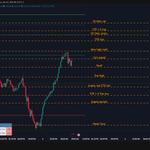
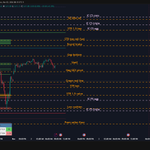
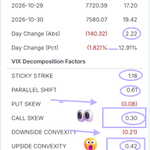
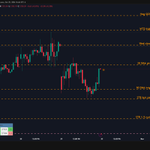
🐐 SPX 0DTE · THU 11/5 — DOES THE ELECTION RALLY HOLD INTO PAYROLLS? SPX rallied 1.6%. VIX collapsed. teapawt.org/i/broadcasts/2dKLdeQgp…

🐐 SPX GAMMA SCALPING CHECKLIST
📖 Read the board
☐ Where are the big positive nodes? (sticky areas, price slows)
☐ Where are the negative zones? (acceleration, price speeds up)
☐ Fresh look, or a stale screenshot from the open?
🗺️ Is the map moving?
☐ Negative node under price shrinking?
☐ Positive gamma building in its place?
☐ Sticky node holding price growing, or running on fumes?
☐ What's above price: fuel or a ceiling?
🔄 Long setup: the flip
☐ Negative node under price flipped positive
☐ Negative gamma overhead = room to run
☐ Risk defined below, fuel above
✂️ Taking profits
☐ Positive node near my target?
☐ Trim right under it, not at it
⚠️ Short on top of a positive node
☐ Nodes above price fading?
☐ Node underneath barely growing?
☐ Small size, tight stop
☐ Chop instead of a flush = out
🪑 Sit on your hands when…
☐ Price is stuck in heavy negative gamma between two heavy positive nodes
☐ Wait for it to pick a direction
🧰 Cross-check before pulling the trigger
☐ Technicals: prior highs/lows, round numbers, moving averages
☐ Vol: VIX and VIX9D vs SPX
☐ Rates: 10-year
☐ Leadership: Mag 7, QQQ, MAGS
Board agrees → press. Board argues → smaller, or wait.
Gotta WATCH the FLOW to be in the KNOW. 🐐
That was a fed Sparked selloff
That decline was driven mainly by the Federal Reserve’s four 2018 rate hikes, rising bond yields, and Chair Powell’s early-October remark that rates were “a long way from neutral,” compounded by U.S.-China trade tensions and late-cycle growth worries.
Compounding the problem, then was in that era. There were a lot of systematic strategies that were selling volatility, but they would buy back their short strikes on the put side and roll them down creating this reflexive selling. They got compounded day after day week after week.

Some well-made points
Another point is that often these are pre-negotiated and what appears to be by at the ask or Cell at the bid is in relation to Local volatility before and/or after the trades that really doesn’t reveal direction at all

Most 0DTE traders will never learn this about reading a big print.
Someone just paid $0.97M for $SPY 785 calls expiring Fri Dec 18. That buyer needs SPX 260.4 points higher just to get their money back at expiry.
They see "a million-dollar call buy, smart money is bullish."
A tiny group of vol desks sees a ledger entry: how much was paid, whether it opened or closed a position, which side of the spread it hit, and how far price must travel to pay.
The average retail trader reads the dollar size and stops. A desk reads the dollar size first and trusts it least. It checks open interest (the number of contracts already outstanding at that strike), then the fill side, then the strike against today's map, then the breakeven.
Same print. Same tape. Completely opposite conclusion.
The difference isn't the premium. It isn't the headline. It's whether the print created new risk or just moved old risk around.
Here's the read, step by step →
THE PRINT ITSELF:
→ 1,280 contracts filled at $7.59. Each contract covers 100 shares, so 1,280 x 7.59 x 100 comes to about $0.97M. That's not a whale signal. That's one ticket on a strike already crowded with 36,354 contracts.
→ 1,280 / 36,354 = 0.04x the open interest. The trade is small next to what already exists, so it could be someone closing or rolling an old position. That's not fresh conviction. That's possibly housekeeping.
→ It filled at the ask, the price sellers are offering. The buyer paid up for speed. Buying at the ask can open a long, or it can cover a short call someone sold weeks ago. That's not proof of a bull. That's proof of urgency.
WHERE THE STRIKE SITS ON THE MAP:
→ SPY 785 converts to SPX 7,874 at the 10.03 ratio. Today's priced range tops out at 7,650. That strike sits past the outer edge of anything the market expects today.
→ The weekly corridor tops at 7,749.9. The strike is still beyond it. That's not a trade on today's tape. That's a lottery ticket on the next few weeks, or a hedge against a short.
→ The call wall, the strike where dealers hold the most call exposure, sits at SPX 8,024 (SPY 800). Dealers run net GEX of -0.08B, estimated from SPY open interest. GEX is dealer gamma exposure, gamma being how fast hedges must change as price moves. Negative means dealers sell weakness and buy strength, which stretches moves. Spot SPX eq. 7,683.7 sits 55.0 points above the flip line at 7,628.7, the level where dealer gamma switches sign. That's not a reason this print works. That's the regime it has to work in.
Now the part retail never computes.
7,568.92 x 0.1697 = 1,284.45
1,284.45 / 15.87 = 80.9 points of expected move for one session (the options-priced daily range)
80.9 x 0.5 = 40.5 points, shelves at 7,528.5 and 7,609.4
80.9 x 2.236 = 181.0 points, weekly corridor 7,387.9 to 7,749.9
80.9 x 0.555 = 44.9 points tend to print before 11:30 AM
Breakeven: 785 + 7.59 = 792.59 SPY
792.59 - 766.63 = 25.96 SPY dollars
25.96 x 10.03 = 260.4 SPX points
→ 260.4 / 80.9 = about 3.2 full sessions of expected move, all in one direction, just to break even.
→ 260.4 vs the 181.0 weekly corridor: the breakeven sits outside a normal week's range.
→ None of it touches your 0DTE trade today. Your levels are still 7,528.5, 7,609.4 and the flip at 7,628.7.
A print at the ask WITH open interest rising by roughly its size the next morning is a new position worth noting. A print without it is the trap that gets you chasing calls on someone else's exit.
The trader who saw "$0.97M bullish" and bought 0DTE calls at 10:23 copied a ticket that may have been a short covering at 0.04x the open interest, on a strike 260.4 points away.
The tape shows you who paid.
The ledger shows you whether anything changed.
Map the open interest, the fill side and the breakeven against these exact levels before every session.
Tomorrow morning, will you check whether SPY 785 open interest moved off 36,354 before you trade off this print?
I put the 4-question options flow and dark-pool checklist into a playbook.
Follow me (I can only send it to followers) and comment "FLOW" below, and I'll send it to you.
Well, I don’t agree with every point, I respect your honesty

One of the things the data analysts on our side obsessed over was "composition"—whether the electorate looked close enough to 2024 for Republicans to win. And despite polls that showed a Democrat blowout, the data kept on telling us the same story: in some states turnout was merely OK, in other states it was downright amazing, and in no state was it catastrophic. There was a genuine sense of optimism on our team: our people were showing up.
So, I asked the smartest data guy I know, does that mean we're going to shock the world? "No," he told me. "We might do better than the polls suggest. But the data is telling us that a lot of Trump/Vance 2024 voters are pissed and planning to vote for the other guys. Our voters are turning out, but they may not vote for us."
Well, that looks prophetic now. Our voters did show up. In Florida, for example, the electorate was 9 points more Republican than Democrat, just a couple points worse than 2024. Undoubtedly there were places we could have done better on turnout. But the main problem is not turnout. The main problem is that many people who voted for Trump/Vance in 2024 voted for Democrats in 2026.
There will be a lot of infighting and arguing over what happened and why that is. One of the pollsters I really respect told me that our economic messaging wasn’t sharp enough down the stretch. I’m sure that’s true.
But the real reason we lost is obvious to almost everyone.
Another pollster—one of the smartest people I know in politics, told me yesterday we’d lose the generic ballot by 13 points. I felt negative going into Tuesday, but even I was shocked by this. In his polling, he saw that a lot of Trump 2024 voters were angry and planning to vote for Democrats. He asked those voters who had abandoned us what would cause them to come back on our team. The top four answers, accounting for nearly all of the responses were:
1) End the war
2) Focus on cost of living/inflation
3) Put America First
4) Change our relationship to Israel
Our voters showed up. And the above four reasons are why many of them voted for Democrats. This is according to a pollster who nailed the results. While many spent Monday attacking Rachel Campos Duffy for calling for a diplomatic resolution to the conflict, it turns out her political advice was sound. (She’s also a great person.)
In the next few months, there's going to be a lot of gaslighting. Expect to hear any number of establishment politicians say the solution to our woes is amnesty. I'm open to the idea that we should change enforcement—by focusing more on businesses that hire illegal labor, for instance. But anyone pushing amnesty is lying to you.
The reason we lost is the war. The president himself said so last night.
If you'd like to argue it was worth it, that losing the Senate for the next 6 years was worth it, then do so. Argue it was a worthwhile cost to pay. Agree or disagree, that's at least honest.
But everyone knows why we lost. And any honest conversation about where we go from here must start there.
I remain hopeful about our country. To the people who are pissed off and want to say, “I told you so”: you’re right, you did tell us so. Take that energy into electing Republicans who share your worldview. To the people who are just pissed at the results, you should be. Let’s take that anger and get back to the work of saving our country.
On the same subject, I wrote this a while back
docmcgraw.substack.com/p/lar…

🚨 MORGAN STANLEY JUST FLAGGED A $250 BILLION AI RISK HIDING IN THE SOFTWARE CREDIT MARKET.
While Nomura and Bernstein highlight the enormous opportunity in AI infrastructure, Morgan Stanley reveals the other side of the boom.
And the numbers are alarming.
Morgan Stanley analyzed ~$250B of software loans:
🔴 16% HIGH AI disruption risk (~$40B)
🟡 49% Moderate risk
🟢 35% Low risk
But here's where it gets interesting:
• ~$20B of high-risk software loans already trade at distressed levels.
• Average loan prices: 97 for low-risk vs. 73 for high-risk borrowers.
• ~75% of high-risk exposure matures during 2027–2029.
• Weaker borrowers could face 550–1,000 bps in additional refinancing costs.
• Front-office applications have the highest share of high-risk loans at 32%.
These are AI vulnerability assessments, not default forecasts.
NOW CONNECT THE THREE REPORTS:
NOMURA: AI data centers are already generating substantial operating profits. Negative FCF largely reflects heavy upfront investment.
BERNSTEIN: OpenAI's infrastructure commitments may be more manageable than feared, but compute oversupply could pressure neocloud economics.
MORGAN STANLEY: AI disruption risk is already influencing software debt valuations—and refinancing pressure could intensify before earnings fully reflect disruption.
THE BIGGER PICTURE:
AI is creating extraordinary opportunities in infrastructure while threatening the economics of weaker software businesses.
The next big AI trade may not just be about who captures the billions flowing INTO AI infrastructure.
It may be about who loses pricing power, who struggles to refinance, and who gets left holding the debt.
AI isn't just reshaping technology.
It's starting to reshape credit markets.

📈 SPX Beyond the Obvious: What’s Under the Hood?
A recent subscriber DM brought up two very different questions. Both get at something traders often overlook: the mechanics beneath the price action.
🔧 The SPX Butterfly: How do I choose my strikes to capture a directional move? It’s not about hoping for a perfect expiration pin. It’s about understanding where gamma may accelerate price—and where that move might stall.
⚙️ The “Profit-Taking” Trap: When a strong rally suddenly reverses, did traders collectively decide they’d made enough money? Or are dealer hedging, liquidity shifts, and systematic flows telling us a different story?
🎯 The Takeaway: One question is about positioning for a move. The other is about understanding what drives it. Both require looking beyond the usual Wall Street explanations.
📬 In my latest From Doc’s Mailbox, I unpack both—and explain how market structure can help us make better trading decisions.
Trade the mechanics, not the narrative.
📖 Read the full article:
docmcgraw.substack.com/p/fro…
QUANTUITION — Analytics + Edge from Experience. 🐐
#SPX #0DTE #OptionsTrading #GammaExposure #MarketStructure
Most traders stare at the same support and resistance levels every morning. Same round numbers. Same prior highs. Same moving averages everybody else is watching.
There's a second set of levels sitting invisible on top of your chart. Dealers are forced to defend them mechanically, regardless of news, regardless of your indicator.
Some of those levels hold price like a vice. Others blow open like a trapdoor.
The article maps exactly how to tell which is which before the open. 🧭
docmcgraw.substack.com/p/mys…
Doc aka Trader McGraw retweeted

🚨 BERNSTEIN JUST DROPPED A MAJOR REPORT ON THE $750 BILLION AI INFRASTRUCTURE BOOM.
After Nomura argued that AI data centers are far more profitable than investors think, Bernstein tackles an even bigger question:
Can OpenAI actually afford its massive compute commitments and who ultimately captures the profits?
The findings are fascinating:
• $750B vs. $614B: Bernstein models ~$614B in OpenAI infrastructure payments through 2030, with annual spending potentially peaking at $184B in 2031. Not every announced commitment is binding, and actual spending could be lower.
• OpenAI's revenue is catching up: Bernstein cites a ~$50B annualized revenue run rate in September 2026, growing ~77% YoY. If growth remains strong, revenue could scale faster than infrastructure obligations.
• Oracle's $300B opportunity: Capacity comes online in stages, with Bernstein estimating only ~57% of modeled OpenAI contract revenue recognized through Oracle FY2030. The backlog represents a multiyear revenue opportunity, not immediate cash generation.
• Microsoft and Amazon have structural advantages: Their integrated cloud platforms, enterprise ecosystems and AI services offer more durable economics than simply renting GPUs.
• CoreWeave faces a different challenge: Bernstein is comfortable with existing contracts but questions renewal economics once compute becomes less scarce.
• The biggest risk may be oversupply, not OpenAI defaulting. Bernstein sees potential supply-demand normalization within 2–3 years, putting pressure on GPU rental prices and weaker infrastructure providers.
HERE'S THE REAL INSIGHT:
Nomura explains why AI infrastructure can remain profitable despite negative free cash flow.
Bernstein explains why that profitability won't necessarily be distributed equally.
The first phase of the AI boom rewarded companies that could secure GPUs, power and data-center capacity.
The next phase may reward companies that control customers, platforms and pricing power.
AI demand can keep exploding while returns on undifferentiated compute infrastructure deteriorate.
Being bullish on AI infrastructure spending is NOT the same as being bullish on every AI infrastructure stock.
That distinction could define the next leg of the AI trade.
$MSFT $ORCL $AMZN $CRWV $NVDA $AMD $MU

🚨 NOMURA: THE MARKET MAY BE MISREADING THE ENTIRE AI DATA CENTER BOOM.
Big Tech is spending hundreds of billions on AI infrastructure. Free cash flow is under pressure. Investors are worried the AI boom isn't profitable.
But Nomura argues something very different:
AI infrastructure is already highly profitable. The cash flows simply haven't caught up with the investment cycle.
Here's the breakdown 🧵👇
1/ The profitability numbers tell a different story.
According to Nomura's November 2 report:
• AWS revenue: $46B, +39% YoY
• AWS operating margin: 38.7%
• Google Cloud revenue: $30.7B, +103% YoY
• Google Cloud operating margin: 36.2%
• Azure growth: +48%
These are not the numbers of an industry struggling to generate operating profits.
2/ The real issue is timing, not necessarily profitability.
Big Tech pays for data centers, GPUs, networking and memory upfront.
Revenue and cash generation arrive over subsequent years.
That creates a classic free-cash-flow J-curve:
CAPEX accelerates → FCF deteriorates → Infrastructure generates revenue → Investment growth moderates → FCF recovers.
3/ Nomura expects operating income to surge before free cash flow.
Its illustrative forecasts suggest operating-income growth could peak around 2029, while FCF growth accelerates later.
That distinction matters enormously for investors valuing AI infrastructure businesses.
4/ Why can't hyperscalers simply stop spending?
Because AI increasingly threatens their existing businesses.
Search, advertising, shopping, software and cloud services are being reshaped by AI agents.
Companies that underinvest today risk surrendering customers, data and market share tomorrow.
5/ Demand may not be the primary constraint. Capacity is.
Nomura cites enormous contracted cloud backlogs:
• Google Cloud: $560.8B
• AWS: ~$496B
• Microsoft commercial RPO: $677B
These figures have different reporting definitions, but collectively illustrate substantial contracted demand.
6/ Big Tech has financing alternatives to cutting CAPEX.
Nomura identifies four paths:
① Accelerate investment
② Freeze CAPEX
③ Use joint ventures and operating leases
④ Monetize contracted future cash flows
Its preferred expectation is continued investment supported by increasingly sophisticated financing structures.
7/ Oracle offers a real-world example.
Nomura highlights Oracle's combination of long-term leases, project financing, customer prepayments and customer-provided hardware.
The broader message: hyperscalers can restructure who finances infrastructure without necessarily reducing how much infrastructure gets built.
8/ This distinction is critical for semiconductors and memory.
Negative hyperscaler FCF does not automatically imply collapsing demand for GPUs, DRAM, HBM or other data-center components.
If spending continues through financing structures, semiconductor demand can remain resilient even while hyperscalers optimize their balance sheets.
9/ What could invalidate the thesis?
A genuine compute oversupply.
Watch:
• Cloud revenue growth
• GPU rental pricing
• Contracted backlog growth
• Data-center utilization
• Memory supply commitments
• Hyperscaler investment guidance
These are more useful indicators than negative FCF alone.
10/ The investment takeaway:
The key question is not simply:
"Why is Big Tech burning so much cash?"
It is:
"Will the infrastructure being built today generate enough durable cash flow to justify its cost of capital?"
Nomura is optimistic.
But the answer ultimately depends on pricing, utilization, investment discipline and the durability of AI demand.
The AI infrastructure cycle may be a cash-flow timing problem rather than a profitability crisis.
$NVDA $MU $GOOGL $MSFT $AMZN $META $ORCL

📝 The Vote Premium Came Out. Then the Market Went Up.
Election night started ugly: futures flushed about 1.5% into the week's floor. Then the hedges bought for the vote lost their value, and the unwind carried $SPX higher all day.
💰 PREMIUM SELLERS: A CLEAN SWEEP
Every Triple Play AND every Double Play expired worthless, conservative to aggressive
The high touched the primary call short strike and faded
Even the most aggressive call spread closed out of the money, by about a point
Receipts in the screenshot 👇
📩 Get the levels and the Triple Play board before the bell: docmcgraw.substack.com/subsc…
📊 THE CLOSE
$SPX 7,690, up 1.6%, about 230 points off the overnight low
Breadth was real: about 3 of 4 stocks up, equal-weight beat the index
🌡️ THE TELL
$VIX −20%. VIX9D −30%, back under VIX
The event premium left, and dealers bought back their hedges on the way up
🔀 THE TWIST
Chips fell even after $AMD's beat: $SMH −2.7%, $NVDA −2.8%
Platforms ran: $MSFT +6.7%, $AMZN +6%, $AAPL +5.4%
🗓️ NEXT
Thursday: jobless claims
Friday: the jobs report. Options price the payrolls day alone at about 53 points.
🔴 Join me live at 8:30 AM ET on X and YouTube as I walk the board before the bell.
Gotta WATCH the FLOW to be in the KNOW. 🐐
#SPX #Options #0DTE #VIX #StockMarket

Most trading psychology advice tells you to stay calm. Don't react. Breathe.
This article disagrees with all of it — not because calm is wrong, but because that framing misses the actual practice entirely.
The farmer in the parable isn't sitting on his porch. He's in the barn. There's a difference, and it changes everything about how you review trades. 🐐
docmcgraw.substack.com/p/the…

📝 The Vote Is In and the Hedges Came Off | SPX 0DTE · Wed 11/4 teapawt.org/i/broadcasts/2peAWKbqE…

Doc aka Trader McGraw retweeted

With the Democrats sweeping Congress, sentiment toward AI at its worst, and hedge fund managers warning of a market crash, $NQ futures fell as much as 2.5% overnight before recovering all their losses.
Meanwhile, $VIX remained negative despite the selloff.
$NQ came very close to its late July bottom, from which the market staged a strong August recovery.
This price action leads me to believe we may have seen the market bottom for the rest of 2026 during last night’s after-hours session.

📝 | SPX 0DTE · Wed 11/4 🐐 SPX 0DTE · WED 11/4 — THE VOTE IS IN. THE HEDGES CAME OFF.
🚨 200 POINTS OF ELECTION-NIGHT CHAOS. 38% OF TODAY'S OPTION PREMIUM GONE BY MORNING.
SPX plunged toward 7,460, then roared back toward 7,660. VIX dropped 11%.
The election premium evaporated. Dealers unwinding hedges likely helped fuel the rally.
But here's the question nobody should ignore:
What happens when the hedging fuel runs out?
That's what today's gamma map is designed to answer.
📖 CHECK OUT MY NEW DAILY PLAN:
substack.com/@docmcgraw
👀 TODAY'S MARKET IN 15 SECONDS
📊 MARKET DATA
Overnight: 7,460–7,660
Morning EM: 7,575–7,685
STR 1.5: 7,550–7,710
VIX: 18.4, down 11%
0DTE straddle: 84.90 → 52.90 (−38%)
🧲 GAMMA
Working zone: 7,615–7,660
⬆️ Upside: 7,640 → 7,660 → 7,700 → 7,730
⬇️ Downside: 7,615 → 7,575 → 7,545 → 7,530 → 7,475
🧠 MY THOUGHTS
VIX below 20: Volatility cooling favors a recovery.
7,660–7,710: Positive-gamma ceiling. Expect friction.
VIX above 20: Downside risk returns.
Below 7,545: Negative gamma near 7,530 can accelerate the decline.
💰 PREMIUM SELLERS
Put spread: 7,520/7,510 — ~0.55
Call spread: 7,715/7,725 — ~0.55
Morning indications; confirm after the open.
THE ONE THING: The election hedges came off. Now watch whether VIX stays below 20.
📚 THE FULL DAILY PLAN GOES DEEPER
Gamma positioning, annotated delta analysis, Triple Play setups, TradingView strings, and my complete IF/THEN Road Map.
I don't just give you levels. I teach you why they matter—and what changes the trade.
🎯 Try Gold FREE for 7 days — includes my Daily Plan and live Discord trading room:
whop.com/options-gelt
📬 Subscribe: substack.com/@docmcgraw
🔴 JOIN ME LIVE AT 8:30 AM ET
YouTube: youtube.com/@DocMcGraw
X: teapawt.org/doc_mcgraw
Trade today's market. Understand tomorrow's.
Gotta WATCH the FLOW to be in the KNOW. 🐐
#SPX #0DTE #OptionsTrading
docmcgraw.substack.com/p/the…

Wednesday, November 4 — 7:45 a.m. Pre-Market Update
An early start today—all of the following positions closed in the pre-market, with fills coming through just after 7:30 a.m. Thinkorswim now allows pre-market trading starting at 7:30 a.m.
These are closing trades on existing positions, not new entries.
Put Spread Closures — Expiring Thursday, November 5
SPX 7325/7305 — Closed 6 spreads at $0.15 debit.
SPX 7320/7300 — Closed 1 spread at $0.10 debit.
SPX 7295/7275 — Closed 7 spreads at $0.10 debit.
Put Spread Closures — Expiring Friday, November 6
SPX 7245/7225 — Closed 5 spreads at $0.15 debit.
SPX 7240/7220 — Closed 5 spreads at $0.15 debit.
Call Butterfly Closure — Expiring Thursday, November 5
SPX 7650/7700/7750 call butterfly — Closed 1 at $11.00 credit
@CharlesSchwab report shows approximately $1,426 in net realized gains for today so far.
