

Leading data-driven insights & market intelligence across Southern Africa
- Tweets947
- Following72
- Followers763
- Likes953





ALT Map of Cape Town in areas of about 5 square kilometres, shaded by building footprint added between 2016 and 2023, with the urban centre outlined. People in the area mapped, 2025: 4.6 million; Building footprint, 2023: 142 km²; New since 2016: 38.4 km² (+37%); New building per person: 8.3 m²; Supermarkets mapped: 976; More than 15 minutes' drive from a supermarket: 7,000.

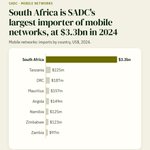
ALT Bar chart: mobile networks imports by SADC country, 2024: South Africa $3.3bn, Tanzania $225m, DRC $187m, Mauritius $157m, Angola $149m, Namibia $125m, Zimbabwe $123m, Zambia $97m. Source: CEPII BACI, from UN Comtrade.

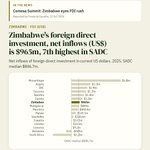
ALT In the news: Comesa Summit: Zimbabwe eyes FDI rush (Financial Gazette). Bar chart of foreign direct investment, net inflows (us$) across SADC with Zimbabwe picked out: Mozambique $5.8bn, Angola $2.2bn, DRC $1.9bn, Tanzania $1.7bn, Namibia $1.4bn, Zambia $1.3bn, Zimbabwe $965m, Madagascar $889m, Mauritius $804.4m, Malawi $530.1m, Seychelles $238.6m, Eswatini $53.1m, Lesotho $33.5m, Comoros $9.2m, Botswana -$649m, South Africa -$2.2bn. Source: World Bank, World Development Indicators.

ALT Deal card: CBZ, BADEA sign intent for proposed US$50m Zimbabwe trade finance facility. Development finance in Zimbabwe, Announced, 22 Oct 2026. Reported by NewZimbabwe (business); not yet confirmed by a regulator, exchange or the companies.

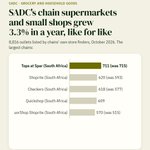
ALT Bar chart: the largest chains, grocery and household goods, SADC, by outlets: Tops at Spar (South Africa) 711, Shoprite (South Africa) 620, Checkers (South Africa) 618, Quickshop (South Africa) 609, LiquorShop Shoprite (South Africa) 570. Source: All The Places (CC0), from brands' own store finders.

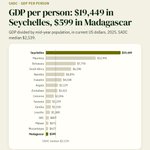
ALT Bar chart of gdp per person in 16 SADC countries, 2025: Seychelles $19,449, Mauritius $12,991, Botswana $7,778, South Africa $6,598, Namibia $4,876, Eswatini $4,108, Angola $3,129, Zimbabwe $3,021, Comoros $2,056, Tanzania $1,319, Zambia $1,318, Lesotho $1,089, DRC $807, Malawi $672, Mozambique $627, Madagascar $599. Source: World Bank, World Development Indicators.

ALT Map of Dar es Salaam in areas of about 5 square kilometres, shaded by building footprint added between 2016 and 2023, with the urban centre outlined. People in the area mapped, 2025: 9.3 million; Building footprint, 2023: 152.5 km²; New since 2016: 54.5 km² (+56%); New building per person: 5.9 m²; Supermarkets mapped: 310; More than 15 minutes' drive from a supermarket: 301,000.

ALT Deal card: Lewis Group: TRP121: Notification of Disposal of a Benefitial Interest in Securities. M&A in South Africa, With the regulator, 21 Oct 2026. Source: JSE (SENS announcements).

ALT Deal card: Mozambique: Commercial banks sign agreements aimed at funding small businesses. Capital markets in Mozambique, Announced, 22 Oct 2026. Reported by Club of Mozambique; not yet confirmed by a regulator, exchange or the companies.

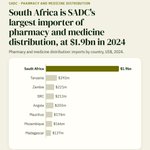
ALT Bar chart: pharmacy and medicine distribution imports by SADC country, 2024: South Africa $1.9bn, Tanzania $292m, Zambia $221m, DRC $213m, Angola $203m, Mauritius $174m, Mozambique $166m, Madagascar $137m. Source: CEPII BACI, from UN Comtrade.

ALT Deal card: Solar SA Investments and Omnia Holdings: merger notice. M&A in Botswana, With the regulator, 22 Oct 2026. Source: Competition and Consumer Authority.

ALT In the news: Gaza province to invest US$126 million in photovoltaic power plant (Club of Mozambique). Bar chart of access to electricity across SADC with Mozambique picked out: Mauritius 100%, Seychelles 100%, Comoros 91.7%, South Africa 90.2%, Eswatini 89.3%, Botswana 80.2%, Zimbabwe 62%, Lesotho 60.6%, Namibia 59.3%, Angola 55.5%, Zambia 53.6%, Tanzania 52.4%, Madagascar 42.5%, Mozambique 36.9%, DRC 22.5%, Malawi 15.6%. Source: World Bank, World Development Indicators.

ALT Paired bars for Tanzania, 2024: each industry's share of output and of jobs. Agriculture: 28% of output, 65% of jobs; Mining and utilities: 11% of output, 1% of jobs; Manufacturing: 8% of output, 4% of jobs; Construction: 14% of output, 3% of jobs; Trade, restaurants and hotels: 11% of output, 15% of jobs; Transport and communication: 10% of output, 3% of jobs; Finance, property, public and other services: 19% of output, 8% of jobs. Source: UN Statistics Division, national accounts; International Labour Organization, modelled estimates.

ALT Map of renewables share of electricity in 15 SADC countries, 2024: DRC 100%, Namibia 97.6%, Eswatini 96.7%, Malawi 95.6%, Zambia 87.5%, Mozambique 83.4%, Angola 73.7%, Zimbabwe 57.1%, Madagascar 42.4%, Tanzania 32.9%, Mauritius 17.9%, Seychelles 15.9%, South Africa 13.6%, Botswana 0.3%, Comoros 0%. Source: Our World in Data, based on Ember and Energy Institute.

ALT One subscription for your whole deal team. For investment firms, banks, law firms, consultancies and embassies. Professional for five people, with more seats available; Invoice and bank transfer billing; A licence to use charts and figures in client work; An onboarding call. From US$2,500 a year.

ALT Timeline of the next national elections in SADC: 4 Nov 2026: South Africa, local elections (date set); 2027: Angola, general election (expected); 2027: Lesotho, general election (expected); Jun 2027: Madagascar, referendum (date set); Oct 2027: Madagascar, presidential election (date set); 2028: Eswatini, parliamentary election (expected).

ALT Deal card: Mozambique: Gaza province to invest US$126 million in photovoltaic power plant. Private equity in Mozambique, Announced, 21 Oct 2026. Reported by AIM, Mozambique News Agency; not yet confirmed by a regulator, exchange or the companies.

ALT Deal card: Durban’s R980m amusement park secures development funding approval. Capital markets in South Africa, Approved, 21 Oct 2026. Reported by Moneyweb; not yet confirmed by a regulator, exchange or the companies.

ALT Bar chart: construction and building materials imports by SADC country, 2024: South Africa $379m, DRC $356m, Mozambique $272m, Tanzania $258m, Zimbabwe $237m, Angola $205m, Madagascar $163m, Mauritius $154m. Source: CEPII BACI, from UN Comtrade.

ALT South Africa's Medium-Term Budget Policy Statement is tabled today. Bar chart of general government gross debt across SADC with South Africa picked out: Zambia 100.6%, Malawi 96.6%, Mozambique 90.3%, Mauritius 86.8%, South Africa 78.4%, Namibia 67.5%, Angola 52.9%, Seychelles 51.2%, Tanzania 49.8%, Lesotho 49.4%, Madagascar 47.7%, Eswatini 44.8%, Zimbabwe 38%, Botswana 34%, Comoros 30.5%, DRC 20.4%. Source: IMF, World Economic Outlook.