

Noooooooob 🎭
Joined January 2021
- Tweets460
- Following158
- Followers484
- Likes2.6K






Pinned Tweet
Introducing the free Position Sizing Calculator 🧮
Live TradingView indicator, updating with every tick on the chart.
It calculates your exact position size and portfolio allocation across different stop loss levels, before you enter the trade! No more confusion about the quantity of stocks to trade. Know you size, know your risk.


Wonderful creation @sahil___singhal
Clean site, clean charts and loads of information under one roof!
🫡🫡

For years I invested like most people do — on tips, on headlines, on moves that had already happened.
It cost me time and money to learn something simple: the market shows its hand before it moves.
So I stopped trying to predict, and started trying to notice. And I noticed something that still feels like a small secret:
A stock about to make its biggest move looks, for weeks, like nothing is happening at all.
The price goes quiet. The range tightens — each pullback shallower than the last: 25%, then 15%, then 8%. Volume fades. On the surface, boredom. Underneath, a handover — nervous sellers giving up, steadier hands quietly taking the other side, until there's almost no one left to sell. Then, on a surge of volume, it breaks the ceiling. The move everyone notices later began right here, in the silence nobody was watching.
Once you've seen it, you can't unsee it. So I built BananaPatterns to do exactly that — scan all ~4,600 Indian stocks for that shape, every day, and surface the few that are setting up.
Checkout here @ bananapatterns.com.
One pattern, in plain English, out in the open. Come learn it with me.
Not a SEBI-registered advisor — this is education, not advice.
189
Just updated my Position Size Calculator TradingView indicator🧮
It already calculated number of stocks to buy using defined % stoploss levels.
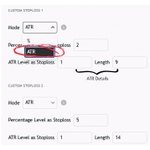
Added another option which now supports ATR (Average True Range) based stoploss levels. 👇
teapawt.org/eeeshanc9/status/20723…

Introducing the free Position Sizing Calculator 🧮
Live TradingView indicator, updating with every tick on the chart.
It calculates your exact position size and portfolio allocation across different stop loss levels, before you enter the trade! No more confusion about the quantity of stocks to trade. Know you size, know your risk.
1
7
1,192
Mostly I trade positions with fixed percentage stops.
That's fine when the volatility is stable or the consolidation of the stock is linear.
But when the volatility increases, a fixed stop doesn't work. It can sometimes become too tight!
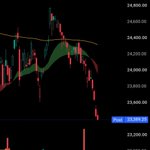
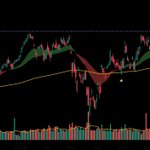
Both stocks seem to have an ideal point for entry (if not perfect), but the volatility of both scenarios is quite different.

1
83


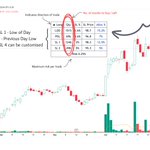
Also added an option to visualise the stoploss levels, because it is also easier to find out a stoploss level by having a look at the chart itself.

1
3
2,095
Link for the indicator 👇
in.tradingview.com/script/Im…

This is exactly what I built a TradingView calculator for.
Input your portfolio size, risk % per trade, and allocation %.
It instantly calculates your exact buy quantity across multiple stop loss levels in real time, on your chart.
Dropping it soon!
teapawt.org/i/status/2069076300656…
𝗪𝗛𝗬 𝗣𝗢𝗦𝗜𝗧𝗜𝗢𝗡 𝗦𝗜𝗭𝗜𝗡𝗚 𝗠𝗔𝗧𝗧𝗘𝗥𝗦 𝗪𝗛𝗘𝗡 𝗬𝗢𝗨 𝗕𝗨𝗬 𝗦𝗧𝗢𝗖𝗞𝗦?
Most traders decide how much to buy based on how much they want to invest. That's the wrong starting point. Here's what you should be doing instead, and why the math changes everything 👇
Here's what that actually means.
With a tight 5% stop you're holding 400 shares.
With a loose 10% stop you're holding 200 shares.
If the stock runs 20% in your favour:
5% stop → 400 shares × ₹100 gain = ₹40,000 profit
10% stop → 200 shares × ₹100 gain = ₹20,000 profit
You risked the same ₹10,000 either way.
1
1
288