

A sometime researcher and always genetics enthusiast, studying genetics of flowering time @UTAS_ 🌱🧬💻Alum. @UnivOfTehran
Australia
Joined June 2019
- Tweets441
- Following629
- Followers381
- Likes8.4K







Esmat Sarafraz retweeted

How to make the world a better place? Another amazing coffee break discussion with early career researchers Jixiang @Kong8399 and Kaushal @Kaushal_Bhati
“Evil prevails when good people do nothing” #TRIC23

Esmat Sarafraz retweeted

The research most producers never see.
Genomics. Molecular breeding. Phenotyping. Predictive tech. All of it exists to find valuable traits earlier and shorten the ten years a cross typically takes to become a variety. #cdnag #plantbreeding #agresearch

Esmat Sarafraz retweeted
Two stresses, one breeding line, same program.
Heat-tolerant chickpea lines are also being screened for phosphorus-use efficiency.
#cdnag #agresearch

Esmat Sarafraz retweeted

Visualize genomic data with ease using gggenomes, an R package that extends ggplot2 to handle and display genomic information intuitively. Whether you’re comparing genomes, analyzing features, or showcasing synteny, gggenomes provides the tools you need to turn complex genomic data into clear, informative visualizations.
Why use gggenomes?
✔️ Genomic-focused visualizations: Specifically designed for handling genomic data, including features, alignments, and comparative analysis.
✔️ Versatile and modular: Create detailed and layered plots for diverse genomic scenarios with flexibility for customization.
✔️ Built on ggplot2: Leverages ggplot2’s familiar framework, making it easy for users to adapt and enhance their visualizations.
The example visualization shown here is taken directly from the gggenomes GitHub repository, demonstrating how it transforms genomic data into compelling plots: github.com/thackl/gggenomes
Curious to learn more about creating data visualizations in R and using tools like ggplot2 and its extensions? Check out my online course, "Data Visualization in R Using ggplot2 & Friends!"
See this link for additional information: statisticsglobe.com/online-c…
#tidyverse #R #datastructure #RStats

Esmat Sarafraz retweeted

🧬🍃 Can Deep Learning Predict Inducibility of Stress-Responsive Gene Expression from DNA Sequence in Arabidopsis thaliana?
by Jordi Alonso Esteve, Niels Aerts, Saskia C M van Wees, Dick de Ridder, and Aalt D J van Dijk
buff.ly/0u8dPMI #PlantScience #genetics

Esmat Sarafraz retweeted
I just published: How do we recognize world-class science? Not by the journal it appeared in
What I told early-career researchers about prediction, rigour, failure, priors — and the tyranny of bar graphs.
Science predicts. Pseudoscience doesn’t.
Twenty-nine years
How to science, and how not to
What’s a failed experiment?
Death by statistics
Ditch the bar graphs
Get credit for all of it
kamounlab.medium.com/how-do-…

How it started vs How it ended
From a full green bay 🌱 to an empty one 🌾, and just like that, the F4 chickpea experiment is harvested!
One step closer to understanding flowering time and breeding chickpeas for a changing climate. 🧬
#Chickpea #PlantBreeding #PlantGenetics


This is how research moves forward🔬🌱

Our in-house parent selection toolkit is now everyone's!
Haplotype-based breeding can maximise long-term genetic gain, but the workflows have been a barrier.
Our ambition with HapSelect: democratise localGEBV and AI-guided parent selection for the whole community

3
253
Esmat Sarafraz retweeted

Sensitivity to stress changes throughout soybean growth, bringing different risks at each stage. Many can be reduced with good management practices. Get the facts on key risks, best practices, and common misconceptions about the soybean growth cycle: ow.ly/CKIQ50Z4K3C #SoyCheckoff

ALT Simple graphic showing the soybean growth cycle. The cycle starts on the left with germination, progressing through vegetative and flowering stages with green leaves, and ending on the right side at full maturity with dry leaves.
Esmat Sarafraz retweeted

Most early-career researchers enter academia because of passion for science. Many leave because of supervision. Our study (2,604 responses, 65 countries) suggests that supervisory practices strongly shape mental health and retention in academia.
Preprint:
biorxiv.org/content/10.64898…

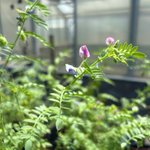
These beautiful #chickpeas 🌱

Legumes - what do you want to know? 🌱
To help guide GRDC investment in pulse research in WA over the next five years, @GGA_WA is seeking input for the 2026 Grain Legume Grower Survey 👇
airtable.com/apptI9bBsYg5wbP…
@theGRDC

4
249
Esmat Sarafraz retweeted

Plants can’t escape the heat—but they can adapt 🌱
Salk scientists have discovered a built-in cellular “thermostat” that helps plant roots sense temperature changes and adjust their growth in real time. Instead of making new proteins, plants rapidly activate existing ones—allowing roots to keep growing and access water and nutrients even in fluctuating conditions.
Why it matters: Understanding how plants respond to environmental stress could help scientists develop crops that stay resilient as temperatures rise.
Learn more: salk.edu/news-release/how-do…
#PlantBiology #ClimateScience #FoodSecurity #SalkInstitute


This is what it looks like when a supervisor genuinely cares about your career, even long after you’ve moved on✨

I completed my PhD in 2001, and began at my current univ as an Assistant Prof the same year. I'm now a Full Prof with an endowed chair
To this day, I get an occasional phone call from one of my grad school profs - usually just to check on how my career is going. It's fabulous
1
93
Research can be this beautiful ☘️😍

@MNSoybean trials compared over 60 giant ragweed and waterhemp control options in a soybean-corn rotation: bit.ly/3XsI9Gy. See more #SoyResearch: bit.ly/3ao9X5I. #SoyCheckoff

94
Esmat Sarafraz retweeted
We’re celebrating the Persian new year, based on the calendar developed in the 11th c by the renowned Persian mathematician and astronomer Omar Khayyam 🪐
Happy new year and best wishes of peace and prosperity!


An absolute necessity 👌

Running a research lab is about leading people.
I created a free toolkit on the human side of lab leadership—covering hiring, mentoring, conflict navigation, lab culture, and performance management.
Open access: doi.org/10.5281/zenodo.19039…
#TeamScience #AcademicLeadership

129
Esmat Sarafraz retweeted

🌱 Studying plant gene function?
This article introduces a practical workflow for exploring gene regulation in plants.If interested, take a look or save for later!
🔗 ybiohub.com/%E7%94%9F%E7%89%…


⚠️ Update: As #Iran wakes up to a new day, metrics show the national internet blackout is past the 84 hour mark.
Years of digital censorship research point to these workarounds:
📻 Shortwave/HAM radio
📶 Cell towers at borders
📡 Starlink terminals
🛰️ Direct-to-Cell satellite

135
Esmat Sarafraz retweeted
ANOVA (Analysis of Variance) is a powerful statistical method used to compare the means of two or more groups. It helps to determine if there are significant differences among the group means. When applied correctly, ANOVA can provide clear insights into the variations within your data.
✔️ Uncover Hidden Patterns: ANOVA allows you to detect differences in group means, helping you understand the underlying patterns in your data.
✔️ Informed Decision-Making: By identifying significant differences, ANOVA supports more informed decisions based on data analysis.
✔️ Efficiency in Testing: ANOVA can test multiple groups simultaneously, saving time and reducing the risk of Type I errors.
❌ Misinterpretation Risk: If assumptions like normality or homogeneity of variances are not met, ANOVA results may be misleading.
❌ Complexity in Large Data Sets: Handling large data sets or multiple variables can complicate ANOVA, requiring careful management to avoid errors.
🔹 R: Use the aov() function for performing ANOVA, and ggplot2 for creating insightful visualizations like density plots to represent the distribution of groups.
🔹 Python: Utilize the statsmodels package to conduct ANOVA and seaborn or matplotlib for creating density plots and other visual aids.
In the attached visualization, a density plot is shown based on three groups (A, B, and C). Such a density by group plot is a useful complement to ANOVA as it enhances your understanding of the group distributions and the assumptions underlying the analysis. In this example, the plot shows different variances among the groups, suggesting we should assess if ANOVA is appropriate or if its assumptions are violated.
For those interested in diving deeper into Statistical Methods, including ANOVA, check out my online course on Statistical Methods in R. This course covers this and many other related topics in detail.
Click this link for detailed information: statisticsglobe.com/online-c…
#database #Python #RStats #DataAnalytics

Esmat Sarafraz retweeted

Breeding for plant‐based proteins in pulse and legume crops: Perspectives, challenges and opportunities
acsess.onlinelibrary.wiley.c…
