

Digital asset data, analytics, and research. https://xitter.cf/t.co/VrKU3mBzsv https://xitter.cf/t.co/oQcrlZNkPF
Zug, CH
Joined July 2018
- Tweets5.8K
- Following61
- Followers609K
- Likes2.2K








glassnode retweeted

Gold is moving on-chain. Gate is leading the charge.
According to @glassnode, Gate ranks #1 in 7-day average tokenized gold perpetual open interest, contributed 42% of the net increase in 2026, and climbed from #9 to #2 since April 2025.
Meanwhile, Gate’s $BTC reserves grew 4.9% YoY while the median across 10 other exchanges fell 6.4%.
The data speaks for itself.

$BTC is boxed in between $80K and $87K.
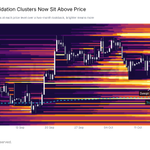
Below, buyers refilled the bids at the ETF and treasury cost basis. Above, the top buyers' break-even, the main asks and the largest liquidation clusters share one zone.
More on ETF flows, MSCI and altcoins in this week's Week On-chain.

BTC treasury companies are in profit but barely buying.
They hold $BTC at a cost basis of about $80K, and price has closed above it since September 18.
In profit, buying can feed on itself: purchases lift price, price lifts their shares, and their shares fund more purchases.

Binance asks and the biggest liquidation clusters sit around $87K.
The top buyers still cap $BTC price near the same levels.
A daily close above that level with ETF inflows would show buyers absorbing the supply.
More in this week's Week On Chain

$BTC is boxed in between $80K and $87K.
Below, buyers refilled the bids at the ETF and treasury cost basis. Above, the top buyers' break-even, the main asks and the largest liquidation clusters share one zone.
More on ETF flows, MSCI and altcoins in this week's Week On-chain.
Binance asks and the biggest liquidation clusters sit around $87K.
The top buyers still cap $BTC price near the same levels.
A daily close above that level with ETF inflows would show buyers absorbing the supply.
More in this week's Week On Chain
Binance asks and the biggest liquidation clusters sit around $87K.
The top buyers still cap $BTC price near the same levels.
A daily close above that level with ETF inflows would show buyers absorbing the supply.
More in this week's Week On Chain
The Q4 levels for bitcoin:native have held so far.
Last month, together with @colin_basco and the @CoinbaseInsto team we put resistance at $87K to $87.8K in our Charting Crypto report. We read the data as near-term consolidation.
Price stalled there and ranged below it ever since.
A break out of the range is likely to spark significant volatility, although another overhead supply cluster sits around $90k.
Read our full quarterly report below👇

Bitcoin moved into an early recovery in Q3, even as the Fed resumed tightening.
Our Q4 2026 Charting Crypto report with @CoinbaseInsto reads the data behind it. Its outlook: constructive, with reasons for near-term caution.
Download the report: glassno.de/4s56RtH


Short-term profit-taking has weighed on bitcoin:native.
Two weeks ago we flagged short-term holders in profit sending the largest share of exchange inflows in a year. This selling has weighed on price since.
The flow has now eased back to its average yearly level.

Bitcoin got through the $85K wall, but the rally is running light. Our new Week On-chain maps what is missing, what altcoins are doing and the levels to watch.


Bitcoin trades near $82k after a quiet week that held above $80k. The selling behind the early October slide eased, but spot and ETF buyers have not returned, while capital keeps moving into newer hands on-chain.
Read the latest Market Pulse 👇
glassno.de/4ei5L8a


Weekend selling has hit altcoins hard.
As fear from equities spills into crypto, the typical altcoin is down over 5%. If the weekend closes like this it would be the largest weekend drop since April.
Since the bitcoin:native low in June, buying Friday and selling Sunday was profitable.

bitcoin:native sellers capitulated again yesterday.
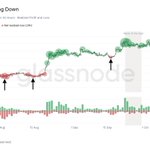
Every burst of loss selling came right at a local bottom: early August, mid-August and mid-September.
Profit taking has slowed since the September high.
If the pattern holds, yesterday's selling just above $80k would mark the floor.


Bitcoin moved into an early recovery in Q3, even as the Fed resumed tightening.
Our Q4 2026 Charting Crypto report with @CoinbaseInsto reads the data behind it. Its outlook: constructive, with reasons for near-term caution.
Download the report: glassno.de/4s56RtH


bitcoin:native is stuck under key cost basis levels.
The buyers of the past two years break even above $88K, and the ETFs are net sellers again. The ETF cost basis near $81.5K has held twice so far.
More on liquidation levels, macro and altcoins in this week's Week On-chain 👇


BTC is holding the ETF cost basis. That line sits near $81.5K, and every daily close for the last 3 weeks has held above it. A large block of bids waits just below. A break under this level could set off forced selling and deepen the drop.

BTC is holding the ETF cost basis. That line sits near $81.5K, and every daily close for the last 3 weeks has held above it. A large block of bids waits just below. A break under this level could set off forced selling and deepen the drop.
The cost basis of investors that bought the top still caps BTC's upside.
Holders who bought 1 to 2 years ago sold heavily as bitcoin:native rallied toward $88k, where the 6 to 12 month group breaks even. Price stalled just under it.
That selling has since slowed considerably.

