data viz | ex @PostGraphics @WSJ @SenseableCity | views are my own
Joined June 2010
- Tweets340
- Following437
- Followers737
- Likes761
Youjin Shin | 신유진 retweeted
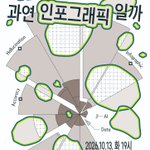
데이터 시각화 커뮤니티 ‘더보다(The VoDa)’의 열세 번째 밋업이 열립니다! 이번에는 ‘AI가 만드는 것은 과연 인포그래픽일까?’라는 주제로 이야기를 나누려고 합니다!
💡2026년 10월 13일 화요일 저녁 7시, 종각역 근처
💡밋업 신청은 아래의 링크를 확인해 주세요!
lnkd.in/giDb4hH3
데이터 시각화 커뮤니티 ‘더보다(The VoDa)’의 열세 번째 밋업이 열립니다! 이번에는 ‘AI가 만드는 것은 과연 인포그래픽일까?’라는 주제로 이야기를 나누려고 합니다!
💡2026년 10월 13일 화요일 저녁 7시, 종각역 근처
💡밋업 신청은 아래의 링크를 확인해 주세요!
lnkd.in/giDb4hH3
Sometimes you open a project & instantly want to steal something.
That's mostly why #DataViz Weekly exists, curating new data viz worth a look.
Pick up an idea for your work. Or just enjoy.
Latest:
- 5K years of eclipses
- How a rumor spreads
- Wildfire risk
- Emoji by generation
🦠 Fake news spreads like an epidemic.
We used epidemic models to simulate how misinformation spreads online. The key? Speed. Fast, distributed debunking can stop a rumour before it takes over. AI raises both the speed and the stakes.
🔗 lnkd.in/gHGPyNzw
Link is here! str.sg/viz-misinformation
57
데이터 시각화 커뮤니티 ‘더보다(The VoDa)’의 열두 번째 밋업이 열립니다! 이번 밋업 주제는 ‘AI와 코드로 디자인하기’ 입니다 :)
💡 2026년 7월 15일 (수)
자세한 내용은 아래의 초대장을 확인해주세요!
💡 forms.gle/6CZ49ajUQhPQMD9M7
2
127
Youjin Shin | 신유진 retweeted
🏆 Journalistic Innovation - Award for Excellence - Regional/Local group goes to @ChannelNewsAsia! A simple budget calculator that gets top marks for frictionless usability, available on the day of the election. Impressive work. Congratulations! #SOPAwards2026
📰
channelnewsasia.com/interact…
Honored to receive a Gold Medal at SND for Individual: Art Direction Portfolio 🥇
Very grateful to the team at The Straits Times for always pushing, supporting, and trusting each other to try new things 🙏
lnkd.in/gziMaarZ
Youjin Shin | 신유진 retweeted
From the boom of AI 🤖, to the strategic use of sea routes 🌊 and on to changes in municipal populations🏡, visualisations are useful for illustrating complex topics. Find out more about them and a new batch of #30DayChartChallenge visualizations in our latest blog!👇
datawrapper.de/blog/data-vis…
📱AI chatbots know more about you than you realise
We invented Marcus. We imagined the questions someone like him might ask a chatbot and gave those questions to Claude, ChatGPT and Gemini. All three chatbots made similar inferences.
➡️ str.sg/viz-aichatbots
#ai #privacy
Stare at a spreadsheet long enough, and the numbers stop meaning anything.
A well-built graphic lands the point in seconds 📊
See this power in action in the latest #DataViz Weekly, with projects covering:
📍 Iran crisis
📍 Pokémon taxonomy
📍 U.S. immigration
📍 Human happiness
Youjin Shin | 신유진 retweeted
🎮 pokemon tree of life
for pokémon's 30th anniversary, explore a visualization and field guide to 1,000+ pokémon. what inspired them, where they came from, and how they connect.
포켓몬 30주년, 1,000개 이상의 포켓몬을 시각화했습니다!
➡️ str.sg/viz-poke30
🎮 pokemon tree of life
for pokémon's 30th anniversary, explore a visualization and field guide to 1,000+ pokémon. what inspired them, where they came from, and how they connect.
포켓몬 30주년, 1,000개 이상의 포켓몬을 시각화했습니다!
➡️ str.sg/viz-poke30
✨ 2025년 흥미로운 데이터 시각화 작업들을 모아 보았습니다!
brunch.co.kr/@visualplot/87
visualizing coffee ☕️
select your brewer, taste notes, and mood, and see your coffee transform into a visualization.
➡️ str.sg/viz-coffee
#threejs #dataviz
Youjin Shin | 신유진 retweeted
Who earns a higher salary than you and the jobs they work flowingdata.com/2025/12/02/w…
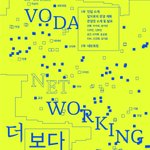
데이터 시각화 커뮤니티 ‘더보다(The VoDa)’의 열한 번째 밋업이 열립니다! 이번 밋업은 드디어 오프라인으로 진행됩니다 :) 운영진 소개와 짧은 발표, 네트워킹이 있을 예정입니다.
💡일시: 2025년 11월 20일 (목) 저녁 7시
아래의 초대장을 확인해주세요!
💡bit.ly/the-voda-11