

Media & Tech Entrepreneur | Founder, Owl & Co, @WonderyMedia, @hernanlopezff | Founding Governor, @podcastacademy
Los Angeles
Joined January 2012
- Tweets3.6K
- Following1.5K
- Followers5.3K
- Likes4.1K




I asked Streamonomics readers on Friday: "Engagement breaks down into three levers: how many people come, how often, and how long they stay. Netflix manages the first and third obsessively. How much headroom is in the second?".
Mobile data (not indicative of overall viewership) suggests MAUs down 4% y/y while DAUs down 10% YTD

New: Netflix users aren’t opening the app as many days a month as they used to.
Sources shared a couple internal metrics that underscore the company’s engagement challenge.
bloomberg.com/news/articles/…

Dear Peter,
In today's special issue of Streamonomics, I'm offering ten questions behind the questions as you dive into your new role at @netflix, including:
1. What Does Success Look Like?
3. Does Netflix Need to Spend More on Marketing?
4. Has Netflix Fallen into the Optimization Trap?
8. Does Netflix Need More Studio Thinking?
I'm also updating our analysis of What We Watched, quantifying by how much licensed has been gaining share of viewership, where and why, our famous 'up and down' chart (see below), and in the client version, 20 additional slides including Cost-Per-Viewing Hour benchmarks, studio, genre and country rankings.
Link below. What question behind the question would you ask?
buff.ly/HRiYCDg

Peacock's revenue grew 34% YoY, the seventh quarter in a row of revenue growth outpacing other streamers (though from a smaller base), alongside its second profitable quarter.
What is driving it?
1. Distribution: Most of the gain came from distribution, up 34% YoY to $1.2B. Early on, Peacock leaned almost entirely on direct distribution. Over the past 18 months, NBCU layered channels and wholesale partnerships on top. Adding YouTube Primetime Channels next quarter will likely make it the second most widely distributed streamer in the US.
2. Advertising: Peacock has the highest advertising ARPU of any US premium SVOD service according to our model, pushing blended ARPU near the top of the pack.
3. Profitability: A year ago, NBCU was absorbing the first quarters of the NBA package. Q3 EBITDA of $261M delivered a 14% margin.
More analysis to come following the call.

Netflix reported record revenues and met guidance in Q3, yet the stock dropped.
The real question rattling investors is whether stalled engagement growth signals slower revenue ahead.
The primary pressure point is US & Canada. It represents 44% of Netflix's revenue and remains its most mature market. Future upside there relies almost entirely on price hikes and ad tier scaling. But members trading down to ad tiers without ARPU parity, paired with potential net subscriber losses, offsets that momentum.
On the earnings call, management cited churn improvements: "Globally and in the US, churn improved year-over-year and was better than forecast."
Churn improvement is welcome, but it does not equal net adds if gross adds decline.
As shown in the attached chart, the gap between revenue growth and premium plan price growth has been steadily shrinking.
Ted Sarandos' letter appointing Peter Rice as Chief Content Officer signaled real urgency to deliver buzzy hits in North America and counter that deceleration.
Can premium hits reignite subscriber momentum in mature markets, or has Netflix reached the ceiling of pure pricing power?
Full analysis drops in Friday's issue of Streamonomics: "Dear Peter, cc: Ted & Greg.". Any questions to add?

The top 10% of microdrama titles captured 70% of views across paid apps in Q3. On Netflix, the top 10% took 62% in 1H26.
The vertical viewership power curve already mirrors streaming.
Today Owl & Co is releasing the first edition of What We Watched on Vertical, tracking 20 leading microdrama apps via our Vertical Index.
A few key data points from the report:
• Catalog explosion: total tracked titles reached 85,000, with 35,000 released in Q3 alone
• ByteDance's PineDrama added 15,000 titles, NetShort 5,000, and DramaBox 3,000 (mostly AI-generated, though live-action expanded too)
• Fantasy drove a major share of new titles and viewership, alongside visual reskins of proven scripts
• Several apps managed to increase views per title even as catalog volume surged
Whether native app, studio, or streamer, attention is moving to vertical first, and the underlying economics look remarkably familiar.
Full report is out now (link in bio and replies). If your team is tracking vertical video, which dynamic matters most: the catalog volume or the concentration at the top?
Peter Rice going to Netflix. His direct reports in '16:
- Dana Walden (Disney)
- Mike Hopkins (Amazon)
- Ravi Ahuja (Sony Pictures)
- John Landgraf (FX)
- Eric Shanks (Fox Sports)
Gary, Del, Rita, Courteney, Randy and yours truly; no wonder I had to leave to start a little podcast company.
Skydance's streaming operations need to catch up with @netflix in subs, LTV per sub, and profitability. But there is one area where they are far ahead: their library.
As shown in our chart below from Owl & Co's Engagement Alpha™ desk, Skydance holds an extraordinary catalog advantage:
• 16% of total Netflix viewing hours in 1H26 (22% in Kids & Family, 30% in Comedy)
• 29% of long-running English-language TV dramas and 26% of comedies (80+ episodes, post-1990)
• 38% of the NY Times "Best TV Shows of the 2000s"
That library is impossible to replicate, and sits on top of 180 current TV shows and series. Skydance's commitment to release 30 theatrical movies a year, one every 11 days across HBO Max and Paramount+, gives them a powerful churn reduction tool.
Yet Skydance DTC has ground to make up. It generated $0.9B in pro forma OIBDA in Q2 2026, roughly in line with Disney and Amazon (Owl & Co estimate) on lower revenue, while Netflix delivered $4.2B in operating income. Skydance claims 200M+ cumulative subscriptions against Netflix's 340M estimated unique subscribers.
The bigger lever is subscriber value: HBO Max and Paramount+ subs carry a much lower expected lifetime value than Netflix, largely driven by Netflix's industry-leading churn.
Banked synergies ($6B annualized) provide breathing room, but legacy linear TV still generates the majority of EBITDA. David Ellison and Ynon Kreiz have to protect cash flow while paying down debt and identifying their next growth engine, whether in vertical video or elsewhere.
The full data breakdown and analysis are in the latest issue of Streamonomics® (clients get it today, public version tomorrow).

What will people watch? Where will they watch it?
Two of the key questions I asked at the first Vertical Media Summit, now answered by our new Vertical Index.
Today, we're rolling out the most significant upgrade to the Index yet: tracking 20 apps, over 80,000 microdrama titles, and the data and insights shaping the vertical video economy.
Until last year, anyone in the microdrama space could spend 30 minutes, check the top 5 apps, and feel informed about what was trending. But with five platforms now launching over 100 titles per week each, manual tracking is impossible.
"This is way more accurate than anything else I've seen," two microdrama CEOs told us recently.
A few highlights in this release:
• Top Titles: rank by views, saves, and estimated time spent (beta), toggling all, paid, or free platforms alone.
• Top Platforms: compare total views, title volume, new releases, views per new release, and share of live action.
• Title Explorer: catalog analysis, metadata, and deep search.
• Studios: see which production houses consistently deliver the most viewed shows.
We've also added vertical news coverage and selected Owl & Co reports directly into the platform.
If you're tracking the vertical video economy, which metric matters most to your team right now: catalog volume, views per release, or time spent?

Are we in a new attention super cycle?
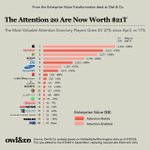
The 20 most valuable companies in the Attention Economy (ATN20) are now worth a combined $21TN, up 27% since I first started tracking them back in early April, vs a 17% increase for the S&P500. But just as it's true for equity markets as a whole, gains are not spread equally.
Being considered a tech player is not enough anymore (@netflix, @AppLovin, @Roblox dropped since April). Being rerated as an AI player is definitely helping some, most notably @Samsung and Tencent, up 70%+. @Meta is now seeing the benefit: up 38% since April, with a big upswing following the successful Muse launch. (Not investment advice)
In this week's Streamonomics, I cover the signals worth watching at some of the ATN20 companies as we're headed into Q3 earnings season. The version for Owl & Co clients includes stats on Muse's first 18 days vs ChatGPT, Claude and Gemini, and how vertical continues to be a driver of increased time spent for Instagram, TikTok, microdrama apps and one streamer.
What story are you paying attention to as earnings get underway?

"Is AI going to kill us all?" That question went mainstream last week, courtesy of execs and researchers at Anthropic and other AI labs.
Hollywood has been asking its own version for two years: will AI kill our industry, our jobs, our incentive to create?
TLDR: no, in my opinion. Hollywood is quietly embracing generative media, at different speeds and in different use cases. Done right, it can accelerate production and development, expand the TAM for individual shows and movies, and make viable projects that would have sat in a drawer.
Our research counts at least 14 independent generative media startups valued at $1B or more, and that's before counting the large video models inside Alphabet and ByteDance. And per The Information, Jeffrey Katzenberg is teaming up with ex-Sora lead Bill Peebles on a startup that will train its own video models and try to win filmmakers.
But paraphrasing Dario Amodei, "the paths we take" will determine whether AI is used or misused in media and entertainment. In this week's Streamonomics (link under my name), I go through some examples that worry me and the ones that make me optimistic.
What's the most interesting use case of AI in media and entertainment you've seen so far?

Hernan Lopez retweeted

Vertical Media on Track to Generate $150 Billion in 2026 as the Booming Sector Fights Crowded Content Field and High Subscriber Acquisition Costs variety.com/2026/digital/new…

Vertical video is a $150B market ex-China yet only three major attention economy players make more than 20% of their revenue from it. For everyone else, it’s all upside.

The vertical video economy will generate $150B in revenue outside China in 2026, up 42% year over year. 94% of it is going to three companies, and for the rest of the attention economy, vertical is nearly all upside. @Meta now earns from Reels more than @netflix earns from everything worldwide.
Today we're publishing the inaugural Vertical Economy Report at Owl & Co, the first to measure the entire vertical video audiovisual language across advertising, consumer spending, and shopping take-rates (not GMV). Not just microdrama (though we size that too, at $4B), but the full picture: TikTok and its related vertical apps, Instagram and Facebook Reels, @YouTube Shorts, microdrama apps, live shopping platforms like Whatnot. We also map how the money flows to creators, studios and IP owners, and other industry participants. (We leave out of our estimate brand deals paid directly to creators)
Business models often limit if not dictate what people watch, and vertical is no exception. TikTok and Reels' high RPMH model favors short, quick-swipe, unscripted video, which gave an opening to microdramas and their serialized scripted content. But Microdramas' early dependence on in-app-purchases resulted in an over-reliance in romance. There is no premium subscription model for vertical video at scale yet, which means the economics are still early and lopsided.
Microdramas are disrupting themselves. Ad-supported platforms went from 15% of time spent to 83% in just five quarters globally (though they still derived a minority of revenue). AI-driven production has pushed new releases up more than 5x since Q2 2025. Time spent has not grown 5x. Guess how close it got? The pattern will be familiar to Streamonomics readers.
Among scaled attention economy players, only ByteDance derives more than 50% of its revenue from vertical. Streamers and studios have barely begun to tap this: the upside is enormous, and largely unrecognized.
We built this report on top of our Vertical Index, which now tracks over 37,000 titles across 14 apps, and our Vertical Map Survey, expert interviews, public and private company reports, and consumption data on hundreds of apps across four key categories. Nine months ago I wrote that vertical video is the third audiovisual language, after film and television. This report combines data, strategy and creative judgment, to judge it as one.
The public edition is available now (link in comments).
One more thing: we're bringing the community back together: the 2027 Vertical Media Summit will be June 8-9 in Los Angeles. More details soon.

And here’s how to pre-register for the 2027 Vertical Media Summit:
buff.ly/ugrIUud


The Streaming 8 collectively made nearly $10B in Q2'26. The next $10B will be harder than the last.
Over the last two and a half years, the eight largest streaming businesses as measured by Owl & Co have executed a remarkable profit turnaround collectively. In Q2'26, @netflix, which had been the only profitable one for years, accounted for only 42% of collective profits. @amazon, @Disney's and @Spotify's streaming businesses are each on track to deliver $2B-$3B in profits in 2026.
But the next round will be different. Streamers want to be platforms and destinations. @YouTube, already a distributor through YouTube Channels, is also becoming a wholesaler via its recent YouTube Premium deal with @peacock. Netflix made its first platform pact with @TF1 in France, and it will likely not be the last. And as advertising becomes an increasingly important way of funding streaming, who ingests, who sells, and what's the LTV tradeoff between ad-free, partial-ad and fully ad-supported will be increasingly important questions.
We've been looking at all of this over the last two and a half years, with an increased focus in recent months (as you can glean from last week's analysis of the YouTube/Peacock deal, thank you to those who reached out). We're developing a new service to help streamers optimize those decisions. If you have questions, insights or data points to share, comment or send me a DM.

Netflix’s UCAN revenue grew 10% in Q2, slower than most price increases - implying subs likely went down. That’s rare in Q2.
Owl & Co's Vertical Index is now tracking 30,000 microdrama titles across 10 apps: Views. Genres. Whether they're AI-generated. Release cadence and volume. No one else has this data.
The top 10 most-viewed microdramas over the last 30 days tell a familiar story: all from @ReelShort_TV and @DramaBoxer, the same way any SVOD original ranking three years ago was a sea of @netflix shows.
But since we started tracking TikTok's microdrama app, PineDrama, the leaderboard changed. Notably, the platform is free, ad-supported, and aggregates views across two apps (although that makes comparisons trickier: Vertical Index clients can toggle any included platform on or off).
This is what platform shifts look like before everyone notices them. As I wrote recently for @Variety, Vertical Video is the third audiovisual language, now worth $150B. Microdramas are to vertical what soap operas were to TVs in the 50s. Vertical news, comedy, reality, documentary, animation are already emerging.
As Netflix kicks off the Q2 earnings season this week, I expect they won't be alone in getting questions or making comments about vertical video. Which format do you think breaks through next?

Next Friday I'm taking my family to see Christopher Nolan's The Odyssey. Phones off, full attention on a giant screen, the shared experience film was built to deliver.
Christopher's brother Jonathan pivoted to cinematic TV (Westworld, Fallout), where value compounds over multiple episodes rather than scarcity.
But there's a third language now, and few from TV and film are speaking it yet. I first called Vertical the third audiovisual language in 2025: not a format, or genre, or aspect ratio. The thesis has only sharpened since.
Vertical video has its own talent, aesthetics and economics. Outside China it's on track for $150 billion in revenue this year. @Meta's Reels alone ran $50B last fall, more than @netflix's entire global business. @amazon, Alphabet, @comcast, @Disney, Meta, Netflix and @ParamountPics all called out their vertical products or announced new ones during the Q1 earnings season. As questions about engagement are top of mind in Q2, expect more attention.
None of this threatens The Odyssey. The mistake isn't betting on film, or television, or the phone. It's believing there are only two languages worth speaking.
My full argument is in Variety: buff.ly/6s42CK8
Which of the leading streamers do you think figures out vertical first?

From Hollywood to Wall Street, everyone is talking about @netflix's engagement.
Wells Fargo called the stock a "fallen angel" last week: forward P/E at -2 standard deviations below the 2023-current average. Investors are worried engagement is slowing as a harbinger of long-term revenue growth slowing. @Lucas_Shaw on Sunday reported that viewers are dropping off in between seasons - which as Streamonomics readers know, is more of a challenge for Netflix because of its over reliance on serialized shows.
In this week's Streamonomics, I analyze some of the data behind the concern. Our preliminary findings indicate Netflix Top 10 viewing hours declined ~4% YoY in 1H26 (though doesn't mean overall viewership has dropped as much, or at all). We've observed only 11 shows crossed 100 million viewing hours in a month, and only two crossed 200 million. Meanwhile, @instagram and TikTok are adding time spent at a neck breaking pace.
Netflix will release its 1H26 "What We Watched Report" next week with Q2 earnings. We've been tracking their self-reported viewership since 2021, and we're already preparing our next analysis for Owl & Co clients.
Two years ago this month, I sent the first issue of Streamonomics to a handful of people who had signed up before it even had a name. Sixty issues later, the number of readers has grown exponentially. There's a team and a data practice behind it now, with the same rigor we bring to client work. Thank you for following along.
Netflix has found its way out of every rut they've had, ultimately coming back stronger. For one, I expect them to still report record revenue and profits and raise guidance. What do you think Netflix does first to turn this around?
