DHM Research, Senior Vice President Also at @OregonAt100 for daily news from the past
Portland, Oregon
Joined October 2009
- Tweets7.6K
- Following776
- Followers3.7K
- Likes768
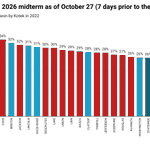



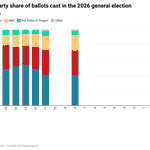


Here is the party share of ballots received on each day for Oregon's election.
Today's ballot share:
-Dem 37%
-Rep 35%
-NAV + other 29%

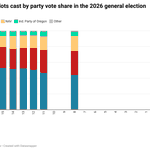
Here is the party vote share of total ballots cast as of today, 7 days before the election.
Party / Today / 2022 final / 2018 final
-Dem / 43% / 40% / 42%
-Rep / 31% / 30% / 30%
-NAV+other 26% / 30% / 28%


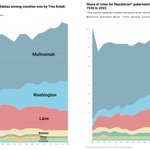
Share of votes for Democratic (left) and Republican* (right) gubernatorial candidates among counties won by Tina Kotek: 1930 to 2022
*1930 treats independent candidate and election winner Julius Mieler as a Republican

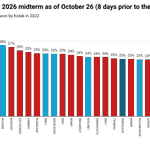
Don't overinterpret these Oregon numbers, but here is the party vote share of ballots cast as of today, 8 days before the election.
Party / Today / 2022 final / 2018 final
-Dem / 44% / 40% / 42%
-Rep / 30% / 30% / 30%
-NAV+other 25% / 30% / 28%


Democratic and Republican ballot share for each day in Oregon.
Oct 16: Dem 64%, Rep 17% (D +47)
Oct 19: Dem 48%, Rep 31% (D +17)
Oct 20: Dem 52%, Rep 26% (D +26)
Oct 21: Dem 53%, Rep 25% (D +28)
Oct 22: Dem 48%, Rep 29% (D +19)
Oct 23: Dem 41%, Rep 33% (D +8)
Oregon ballot return update and why it probably doesn't say much about final turnout. Those who have voted are just regular voters.
Democrats
-Voted in 8 of last 8 elections: 49%
-6+ of 8: 75%
-Age 65+: 64%


The final October consumer sentiment numbers are out from the University of Michigan. Here are the changes by party.
Dem 36.6 (+1.0)
Ind 42.4 (-5.3)
Rep 83.0 (+5.8)

The age composition of Oregon's electorate from 2018 to 2026.
The projected ballots for 2026 assume that turnout by age is the average of 2018 and 2022.


I am tracking Oregon ballot returns, but avoiding reading anything into them. Those who have voted were almost certain to anyway.
Ages and vote history of voters who have returned ballots.
Dems
-Age 65+: 65%
-Voted 8 of 8 of the past 8 primaries and generals: 53%
-6+ of 8: 78%

Reposting Republicans. There was a typo in my text. Republicans
-Age 65+: 65%
-8 of 8: 46%
-6+ of 8: 74%
Thanks to @SpaceOddities for pointing out the error.

Agree with Kevin.
Whether Oregon--or Texas, Wisconsin, etc.--allow data centers or not we will still have to make decisions about our relationships with AI.