(Current) Postdoctoral Researcher in AOS program, Princeton University. Ph.D. from Penn State. Atmospheric Dynamicist. Loves Poetry and Music.
- Tweets33
- Following69
- Followers53
- Likes129


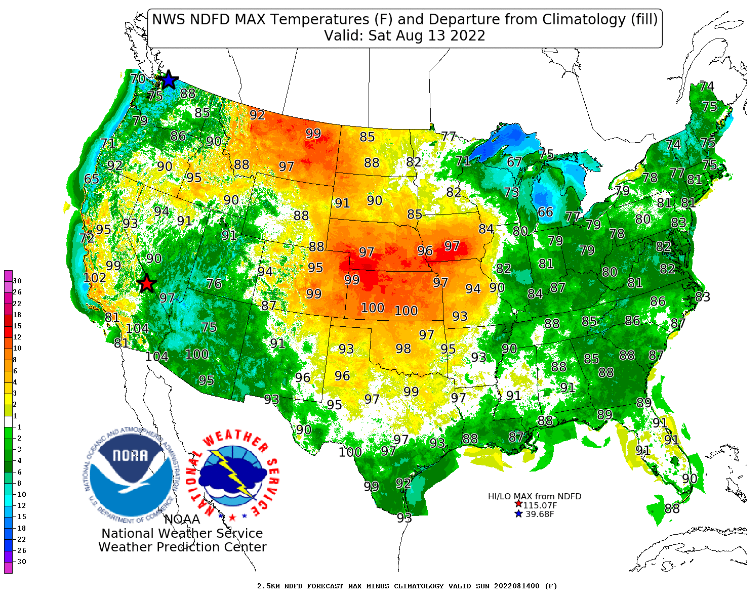
ALT A strongly meandering jet is driving heat extremes. (Source IE)


ALT Line graph time series of 2023's daily global sea ice extent in red shading compared to each year from 1979 to 2022 using shades of purple to white for each line for between the months of January and April. The year 2018 is also highlighted in yellow, which is the previous absolute record low. There is substantial interannual and daily variability.


ALT Line graph time series of 2022's daily Antarctic sea-ice area compared to each year from 1979 to 2021. Lines are colored from purple in 1979 to white in 2021. 2022 is shown in red. There are no statistically significant long-term trends visible in this graph for the month of December. Data are smoothed using a 5-day running mean from the Sea Ice Index v3.

ALT Line graph time series of global ocean heat content for the 0-2000 m layer for 3 year averages (red line), yearly averages (black line), and five years averages from the late 1950s to 2022 (blue line). There is a long-term warming trend. Ocean heat content is measured in 10^22 Joules with a y-axis range form -10 to 30.

ALT Heat map-style graphic showing monthly air temperature rankings in the Arctic at the 925 hPa level for each month from January 1979 to October 2022. There is a long-term warming trend evident in each month. Blue shading is shown for colder months, and red shading is shown for warmer months. A yellow number is shown for each grid box to display the actual temperature ranking. October 2022 was the 5th warmest October on record.

ALT Three line graphs shown side-by-side for conditions in the Arctic in September 2022. The graphs show air temperature, sea-ice extent, and sea-ice volume. September observed the 6th warmest, 11th lowest sea-ice extent, and 10th lowest sea-ice volume.





ALT Three orthographic maps showing 2-m air temperature anomalies in July 2022, May 2022 to July 2022, and August 2021 to July 2022. Red shading is shown for warmer anomalies, and blue shading is shown for colder anomalies. Most areas are warmer than average. The mean temperature anomaly for each map is also displayed. Anomalies are calculated relative to a 1981-2010 baseline.