OddStats (@OddStats) header
OddStats (@OddStats) profile picture

Retired finance professional. I can't see the future and neither can you; anyone who says different has something to sell. NOTHING I SAY IS INVESTMENT ADVICE.

Joined April 2013
Photo by OddStats (@OddStats)Photo by OddStats (@OddStats)Photo by OddStats (@OddStats)Photo by OddStats (@OddStats)Photo by OddStats (@OddStats)Photo by OddStats (@OddStats)Photo by OddStats (@OddStats)Photo by OddStats (@OddStats)Photo by OddStats (@OddStats)Photo by OddStats (@OddStats)
You all can't possibly be this fucking stupid.
155
64
15
1,338
423,530
VIX has just set the record for the fastest round trip from the 27s to the 17s back to the 27s again. The record it just broke by 4 calendar days? That was set in Oct 2018, a week before Trump's *other* midterm election. How's that for a coincidence?
4
2
1
43
2,289
QQQ also breaks the low from its own -6% day.
SPX has broken below the low of day from the -4% day on November 5th. I have no idea what this means, but the odds of your eventual death remain at 100.0%. Good luck.
6
49
5,120
SPX has broken below the low of day from the -4% day on November 5th. I have no idea what this means, but the odds of your eventual death remain at 100.0%. Good luck.
18
7
1
150
10,264
It's been 408 trading days since SPX had a close that saw at least a -10% draw down (at ANY future point; mid day or at a close). That is the 2nd longest streak in the past 30 years. It's not just in your head.
6
6
3
142
10,102
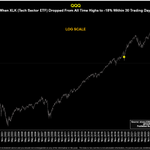
XLK, the tech sector ETF, has dropped -18% from all time highs set within the past 30 trading days. The three times this happened? • The beginning of the dot com collapse • COVID • This week
$XLK is down more than 18% since the last $SPY ATH on October 6. Six sectors are up more than 5% since then.
4
2
91
8,158
We did. We just joined this shit fest of a list of eras.
WHEW! If SPX closes down at least -1% today, we join this fucking incredible list of dates that match the action over the past 8 trading days: [1/3]
9
7
2
194
24,505
SPX is currently down -2.2% for November, a little more than half way through. The only Novembers on SPX in the past 30 years that were worse than -2.2%? • 2000 • 2007 • 2008
22
28
11
368
32,426
I wanted to know what it looked like when QQQ had a • -1% Friday followed by • A -2.5% Monday • Within 10 days of having had a -4%, -5%, or -6% day • All with VXN under 40 Except that it had never happened until today.
16
10
1
408
39,698
It also happened 11 times with VXN *over* 40. And with the exception of the one in March 2003, just before the market took off like a rocket, all of these were total shit shows, with the market mid collapse in major bear markets.
7
1
64
8,108
WHEW! If SPX closes down at least -1% today, we join this fucking incredible list of dates that match the action over the past 8 trading days: [1/3]
32
12
6
322
91,431
• 17 dates during the Great Fucking Depression. The first sample in this study is Oct 29, 1929. Dick hard yet? • 1 date right after WW2 ended • 1 date in Oct 1955 Then the good stuff... [2/3]
5
3
111
18,898
• October 1987 • September 2001 • 3 dates during the GFC • COVID • Liberation Day ...and possibly today. A bear's absolute fucking wish list of dates. [3/3]
16
5
1
231
15,600
OddStats retweeted
Green by lunch or I eat my hat.
12
1
111
11,735
I've been trying to find all the SPX/QQQ companies in 1999/2000 who got at least 1/3rd of their revs from just one other company and you'll never fucking guess what happened to all four qualifying company I've found so far.
JUST IN: Anthropic reportedly made up 34.5% of SpaceX’s revenue last quarter, even more than the US government.
45
89
6
3,016
264,932
[All four saw between an 80% and 98% crash.]
10
4
576
33,832
You know what would be an interesting study? See which days Bluekurtic and I both posted obviously bearish-leaning data and what happened after that.
Sorry bulls, this does not look good. Today, the market weighted S&P 500 $SPY gapped down over 0.5% while equal weight RSP opened higher. SPY was lower 5 days later in 7 of 9 cases. Let's just get this over with and find a bottom.
6
3
86
11,819
It did. Panic needlessly.
With hours until the open, it's looking like QQQ could have its second -1% gap down in a 3 day period; within a week of a -5% day. First, here are forward returns and HOLY FUCK THOSE DRAW DOWNS How about a median 5-day draw down of -9.4%? Did you hear me? Then what did I say?
10
1
126
14,705
Looking for the highest correlated 8-day period on VIX to the last 8 days? That would be mid June 2011. After a very good July on SPX, the index crapped out, gave back all those returns, and found itself down -11% by mid August. n=1, dummy.
4
1
69
10,110
With hours until the open, it's looking like QQQ could have its second -1% gap down in a 3 day period; within a week of a -5% day. First, here are forward returns and HOLY FUCK THOSE DRAW DOWNS How about a median 5-day draw down of -9.4%? Did you hear me? Then what did I say?
31
30
12
382
85,728
PLAINER ENGLISH: A bit to explain here, so get comfy. QQQ still has a couple hours to go until the open, so things could turn around, but as of this second, it looks like QQQ will likely have it's second -1% gap down at the open within 3 days. That 3-day-period will occur within 5 trading days of a -5% day, meaning we've recently had a horrifying day on QQQ and now, barely a week later, we're going to have multiple -1% gaps down. And how has QQQ reacted in the past? Well, shittily. The median draw down over the NEXT 5 days (so, this would be from the close tonight) is -9.4%!!! Some things you should know, though: 1) Every prior event happened with extremely elevated VXN (VIX for QQQ) 2) Every prior event happened in a major crash; dot com, GFC, or COVID. 3) n=16; you get to decide how useless that is (hint: very) 4) No matter what you think you're going to do with this, you're going to lose money. You'll see.
15
2
1
118
8,357