

Market & Portfolio Strategist | Macro, Market Structure & Digital Assets - Founder of 62ndAlpha - Sign up https://xitter.cf/t.co/Wl4EgCdEzg
Joined November 2021
- Tweets34K
- Following135
- Followers5.2K
- Likes32.3K



We called the bottom. Told you to buy when you couldn’t bring yourself to do it.
Now I’m telling you $ETH is going to breakout this cycle and 5x its previous ATH.
Whether we care or not, believe it or not, invested in it or not - eth will be the blue chip adoption mechanism for institutions.
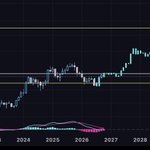
That chart tells the other side of the story.
COMPRESSION.
Which has now been over 2000 days…
Charts resolve themselves, one way or the other.
Which way ANON?


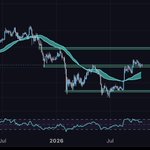
Got the sweep of lows. Trend is strong.
Narrative is $ETH is dead.
We are in the bottoming out phase. That is certain. Will we see 1200-1400 before new highs?
Maybe.
Macro investors are aggressively buying.
So far it’s playing out exactly how we thought it would.


$AERO just faced a sharp rejection near $1, but the weekly bullish structure remains intact. 🐂 📈
The question now is whether buyers defend the pullback ❓🤨🙋🏽♂️
📍 $0.52–$0.57: Key weekly support
🐂 Hold support: Look for a higher low and bullish reversal
🔊 Reclaim $1: Breakout confirmation on a weekly close, ideally with strong volume
🎯 ⬆️ Upside: $1.50–$2+
❌ Weekly close below $0.52: Bullish thesis invalidated… 🐻
I’m watching for confirmation rather than chasing the bounce.
Healthy correction before the next leg higher, or the beginning of a deeper breakdown?


$HYPE weekly structure looks incredibly bullish. 🚀
I am slowly getting back in here.
Price is retesting a major breakout zone while maintaining its broader ascending structure.
🕯️ $65: Key 0.618 Fibonacci retracement and horizontal support.
🕯️ $70–$75: Weekly bull market support band providing dynamic support.
🕯️ Higher lows: Long-term ascending trendline remains intact.
🕯️ $90–$100: Major resistance and the next breakout target.
The confluence here is hard to ignore. A successful retest followed by a weekly reclaim of $90–$100 could open the door for price discovery toward $150–$200.
As long as $65 holds, the macro bullish thesis remains compelling.
$HYPE looks like it’s building the foundation for its next major expansion. 👀

Most people will disagree with me. That’s okay. But I have maintained for over two years that bitcoin dominance will make a new local high before we ever see an altseason.
Why?
Because - bitcoin has to prove to participants it can get back into extreme overvaluation, which it has not since 2020/21.
It’s a game of psychology.

People acting like price shouldn’t go down.
I’m bullish below 80k.
Stack some alts.
$BTC

$SUI
Corrective phase almost complete and target reached.
BMSB squeezing the 20w after an anticipated rejection from major diagonal.
Discount zone.

Total crypto market cap (M)
We got the reversal at macro .618, with a monthly engulfing morning star.
The hardest, most boring part of every reversal is waiting for the charts to confirm it with its next impulsive move.
Buyers and sellers tend to be evenly matched at these important level.
Once confirmed - the losing side capitulates initial bias.
A good time to sell rips and buy dips in the altcoin space.


$AVAX currently retesting the BMSB and coming out of a bear market accumulation phase.
Weekly RSI broken. If the charts gains acceptance above these key levels, the move to $40 will be smooth.
BUY accruement layers.

$AVAX steady in accumulation.
Next time we break the BMSB we pump hard. Avalanche will rise from the dead.☠️


I’m live streaming the Friday mentorship program today.
Going to cover trade setups.
Entries.
Exits.
Risk management.
People pay a lot of money for this group every Friday - come see what the fuss is all about.
Starts in 30 min.
1pm mountain standard time.
Link - youtube.com/@62ndalpha?si=t8…

We aggressively accumulated the lows on $INJ.
Here I circled this post from 4/11/26 for you.
HIGHER.


Price is above 50wSMA.
Price above HTF support.
Metrics have bottomed.
Supertrend flipped green.
Just keep it simple.
$BTC

$BTC might put In a wider correction.
Hold 80k, we go higher.
Lose it, 74-75k is likely.
The market regime is in buy the dip mode.
When do we stop buying the dip?
Never, not at this point.


$SUI is approaching a major structural test. 👀🔥
The setup: hold ~$0.85–$0.90 support, break the descending trendline, then reclaim $1.30–$1.40.
That reclaim could turn this recovery into a larger reversal, opening the path toward $2, $3, and eventually $4.
Lose support and the bullish roadmap weakens. Until resistance flips into support, this is a setup, not a confirmed breakout. 🕯️
Bigger picture: a rejection does happen, strong bottoming formation with a MASSIVE iH&S.

$RENDER looks like it could be next in line for a major move. 👀🔥
This chart has spent almost TWO YEARS grinding through lower highs, lower lows, and a relentless descending channel.
Now price is pushing above the upper boundary of that channel and challenging the SECOND resistance line marked in red.
That’s why this area matters. Breaking one trendline is encouraging. Clearing both would strengthen the case that the broader downtrend is finally losing control. 📈
The move off the recent lows has brought RENDER straight into the ~$2.10–$2.25 decision zone.
What I want to see next:
✅ A decisive weekly close above that resistance
✅ A retest that holds as support
✅ Follow through that breaks the previous swing high
If that happens, my upside roadmap is:
🎯 ~$2.70–$3.00 > first resistance zone
🎯 ~$4.00–$4.50 > previous trading area
🎯 ~$6.00 > bigger historical resistance
These are checkpoints, not guaranteed destinations.
A rejection here could still send price back toward ~$1.50–$1.70, so the weekly close matters more than a wick through resistance.
The reason I’m watching closely: it’s attempting to break the structure that has capped every recovery for nearly two years.
Clear it. Hold it. Then we could see a very different chart. 🕯️🚀
On a different LEVEL 👇🏾👇🏾👇🏾👇🏾
The fundamentals make this setup even more interesting. 👀🔥
Render connects GPU owners with users who need computing power for 3D rendering, and its compute infrastructure supports AI workflows including inference, training, and generative imaging. That gives it exposure to the infrastructure behind the AI narrative.
There’s also a link between usage and the token: paid work drives RENDER burns through its burn and mint model. More demand can mean more burns, although emissions still matter when assessing the net supply impact.
And this is why I’m watching it alongside $NEAR
⚡ RENDER — GPU compute for rendering and AI workloads.
⚡ NEAR — infrastructure that helps AI agents move assets and execute transactions across blockchains.
My thesis: if the AI trade starts gaining momentum again, attention could spread across BOTH compute infrastructure and the emerging agent economy.
NEAR getting attention could bring investors back to the wider crypto AI sector and RENDER has a clear story within that rotation.
Combine that potential narrative with the breakout attempt on this chart, and you have a setup worth watching closely.
The catalyst is attention. The staying power has to come from adoption. 📈🔥
